As of April 20, 2026, at 8 a.m. ET, Bitcoin is trading at $75,213, remaining within a defined consolidation range while the overall bullish trend persists. Technical indicators across various timeframes reveal a market in flux, balancing short-term uncertainty with an overarching favorable macroeconomic environment.
Key Insights:
- Bitcoin remains steady at $75,213 on April 20, 2026; signs of consolidation suggest minimal market impact near the $76K mark.
- Data indicates that out of fifteen moving averages analyzed, ten are bullish; upward movement relies on breaking through the $76K barrier soon.
- The oscillators for Bitcoin show mixed signals with MACD positioned at 1,630; future price action hinges on maintaining support around $74K.
Bitcoin Chart Analysis
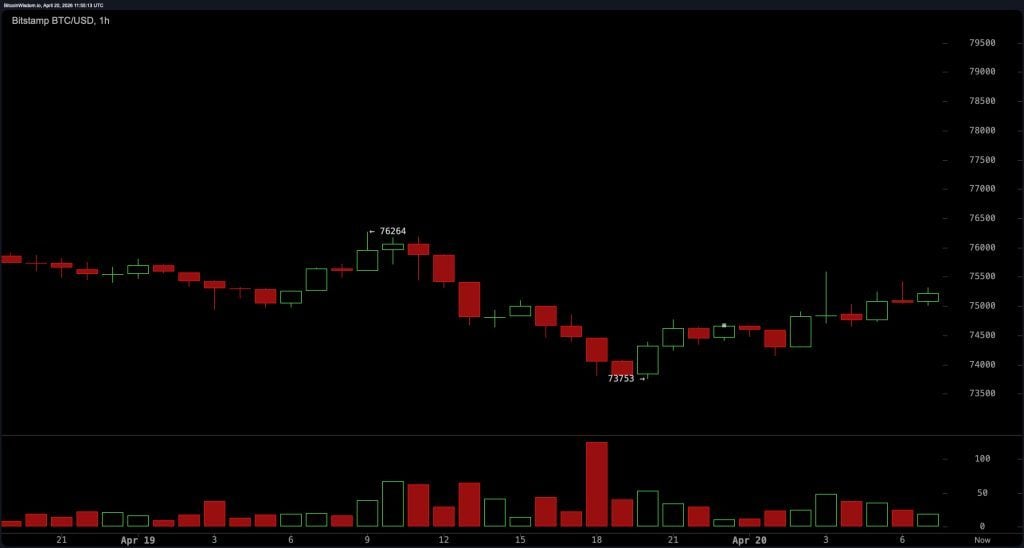
The hourly chart for Bitcoin illustrates a range-bound pattern with initial recovery signs following a bounce off approximately $73,700. The price action is creating higher lows which signal increasing buying interest; however, momentum appears weak due to low trading volume. Immediate support has been established close to the $74K level while resistance holds firm between $75.5K and $76K. This narrow consolidation reflects an equilibrium between buyers and sellers in the short term.
From an execution perspective on this hourly timeframe favors strategic positioning over strong directional bias. The lack of significant volume growth suggests that any breakout attempts may not be sustainable unless there’s increased participation from traders. Those observing this timeframe would interpret a confirmed move above the resistance level of $76K as potential fuel for further bullish momentum; conversely repeated failures in this area reinforce the current range-bound scenario.
<pThe four-hour chart presents a shift from bullish momentum into sideways consolidation accompanied by slight bearish tendencies. The price has struggled to maintain levels near $78k and has formed lower highs indicating diminishing short-term strength in buying pressure.
Support levels are found between approximately$73k-$74k while resistance clusters around$75k-$76k reflecting distribution where traders reassess their directional outlooks.
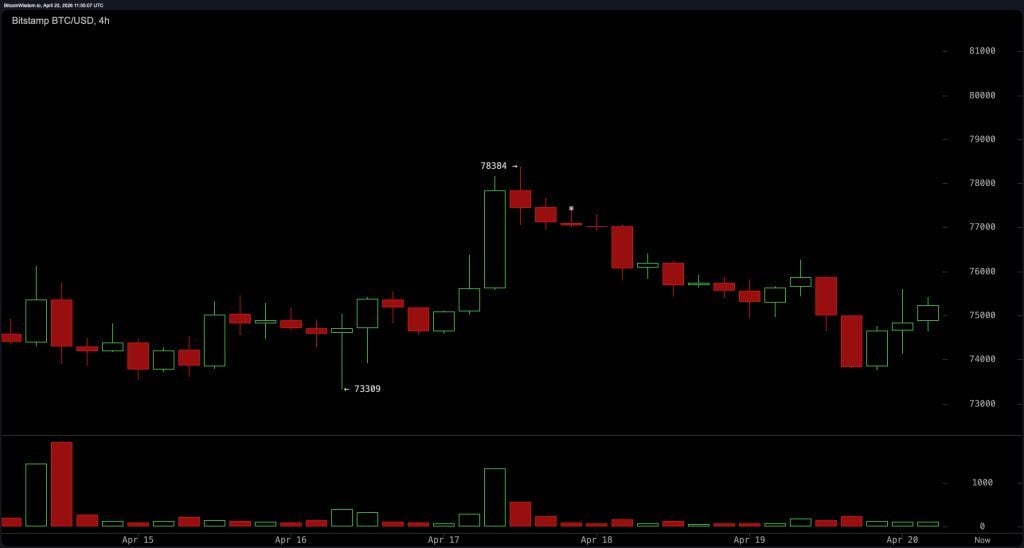
The four-hour analysis indicates neutral-to-bearish momentum unless there’s decisive breakout activity observed soon.
The failure to reclaim higher resistance levels implies active supply limiting upward movement shortly;
however absence aggressive selling pressure suggests ongoing consolidative behavior rather than definitive trend reversal aligning with broader market conditions.
A look at daily charts reveals that Bitcoin continues its pattern showcasing higher highs along with higher lows confirming sustained macro-bullish trends
Recent advances towards$78,$300 were backed by increased volumes validating demand strength followed by controlled pullbacks into periods characterized by consolidation
Critical support resides between$72-73 thousand whilst deeper structural supports exist closer towards69 k
Resistance remains focused within ranges spanning from$76500-$78500

$ BTC / USD daily chart via Bitstamp as Of april twenty th two thousand twenty six .
This daily structure indicates current pricing represents healthy retracement occurring within ongoing uptrend instead suggesting reversal occurring now appears likely ;the marketplace seems caught deciding whether continuation will prevail or if deeper corrections loom ahead ;as long prices remain above seventy-two thousand regions broadly positive framework structurally sound .
Oscillators provide predominantly neutral outlook reinforcing narrative centered around consolidations currently prevailing ;Relative Strength Index ( RSI ) rests firmly sitting sixty-nine implying balanced forces without overbuying scenarios existing alongside Stochastic oscillator reading sixty-eight Commodity Channel Index ( CCI ) reaching seventy-five both exhibiting neutrality positioning here too!
Average Directional Index( ADX) recorded nineteen indicating weak trending confirming absence conviction toward directionality presently seen here ! Nonetheless some positive signals emerge present themselves such Awesome Oscillator ( AO) clocking four thousand seven hundred nineteen Momentum(MOM) showing two-thousand two hundred sixty-six Moving Average Convergence Divergence(MACD) hitting sixteen thirty all highlighting underlying pressures pushing upwards!
Moving Averages indicate cautiously optimistic bias dominating sentiment amongst traders majority signaling buy conditions prevailing ! Shorter midterm indicators including Exponential Moving Average(EMA10)=seventy-four thousand two hundred fifty-five Simple MA(SMA10)=seventy-four-thousand-four-hundred thirty-seven EMA20=seventy-two-thousand eight-hundred twenty-seven SMA20=seventy-one thousands nine hundred sixty-four confirm rising trends similarly EMA30,SMA30 EMA50 &SMA50 also supportive however longer term resistances become apparent since EMA100 registered seventy-five-thousand-two-hundred-seventy-six indicating sell patterns together coupled alongside EAM200 pointing eighty-two-757 & SMA200 reaching eighty-six-three-hundred thirty both highlighting considerable overhead pressures still looming ahead!
Bullish Outlook:
A confirmed breakthrough along consistent holding beyond threshold zone valued around seventy-six-k would substantiate continued bull run entrenched within already established upward trajectory witnessed throughout recent times supported further evident patterns comprising successive peaks/troughs emerging combined various indicator signals like MACD,MOM,AO reinforcing expectations aiming retest zones targeting heights nearing sevent-eight-k approaching possible expansions given sufficient volumes validate movements taking place effectively!
Bearish Outlook:
If rejections persist observed repeatedly particularly confined spaces ranging anywhere about five-fifty-sevenths till sixthousands leading breakdowns falling below thresholds hovering round seven-forty k could indicate immediate bearish control paving way downwards potentially targeting lower ranges nearing sevent-three k extending risks heading southward touching base even lower realms possibly grazing close vicinity surrounding low sixties thereby aligning closely weakening moments depicted earlier noted regarding Four hour timelines also reflected through ADX readings being quite low suggesting lackluster trends existing simultaneously generating additional sell indications stemming longer durations visible across EMAs namely EMA100&200 signifying deeper corrective phases evolving unfolding gradually thereafter too!