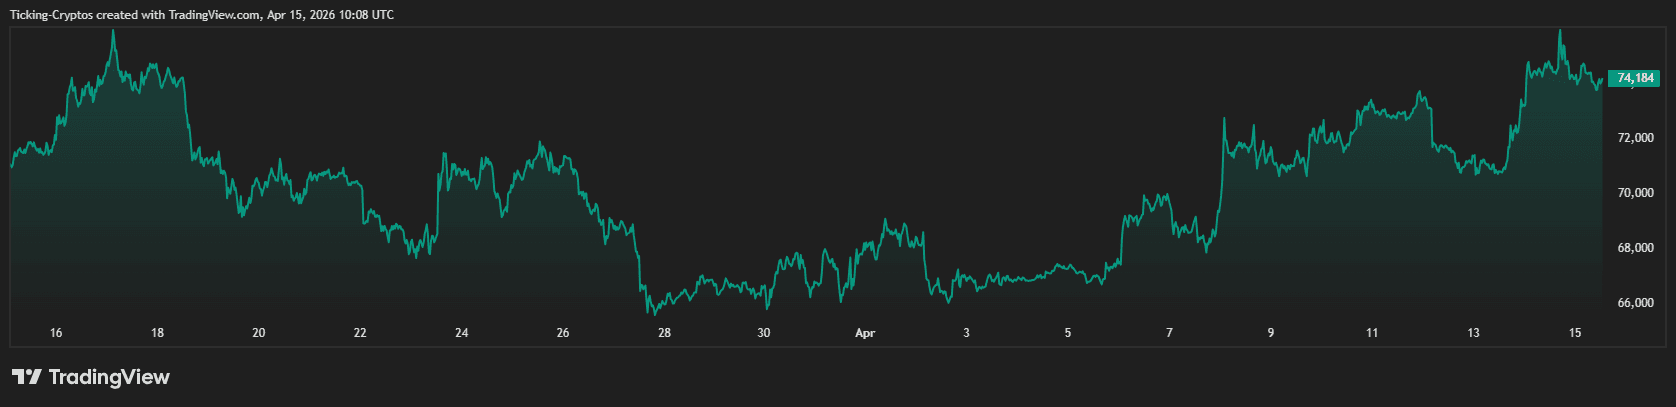
Bitcoin ($BTC) has recently experienced the kind of volatility that is characteristic of the cryptocurrency market, climbing to a peak of $76,088 before entering a corrective phase. As of April 15, 2026, Bitcoin’s price is stabilizing around $74,000. For novice investors, witnessing a “red candle” can be daunting; however, for experienced traders, such fluctuations often indicate an essential stage known as price consolidation.
What’s Causing Bitcoin’s Decline Today?
The recent drop in Bitcoin’s value can largely be attributed to a necessary correction following an extended rally. After surpassing significant psychological thresholds above $70,000—thanks to reduced geopolitical tensions and inflows from ETFs—the market reached its local peak. Traders are now cashing in on their profits which has prompted the price to seek established support levels for confirmation before making another upward move.
Understanding Consolidation in Crypto Trading
In technical analysis terms, consolidation refers to a period during which an asset’s price fluctuates within defined boundaries after experiencing significant movement. You can think of it as the market taking a momentary pause.
This phase typically involves:
- Reduced Volatility: The dramatic swings observed during breakouts settle into smaller variations.
- Lack of Direction: Neither buyers nor sellers dominate completely; hence prices tend to move sideways.
- Diminished Volume: Trading activity often decreases as participants await signals for either breakout or breakdown.
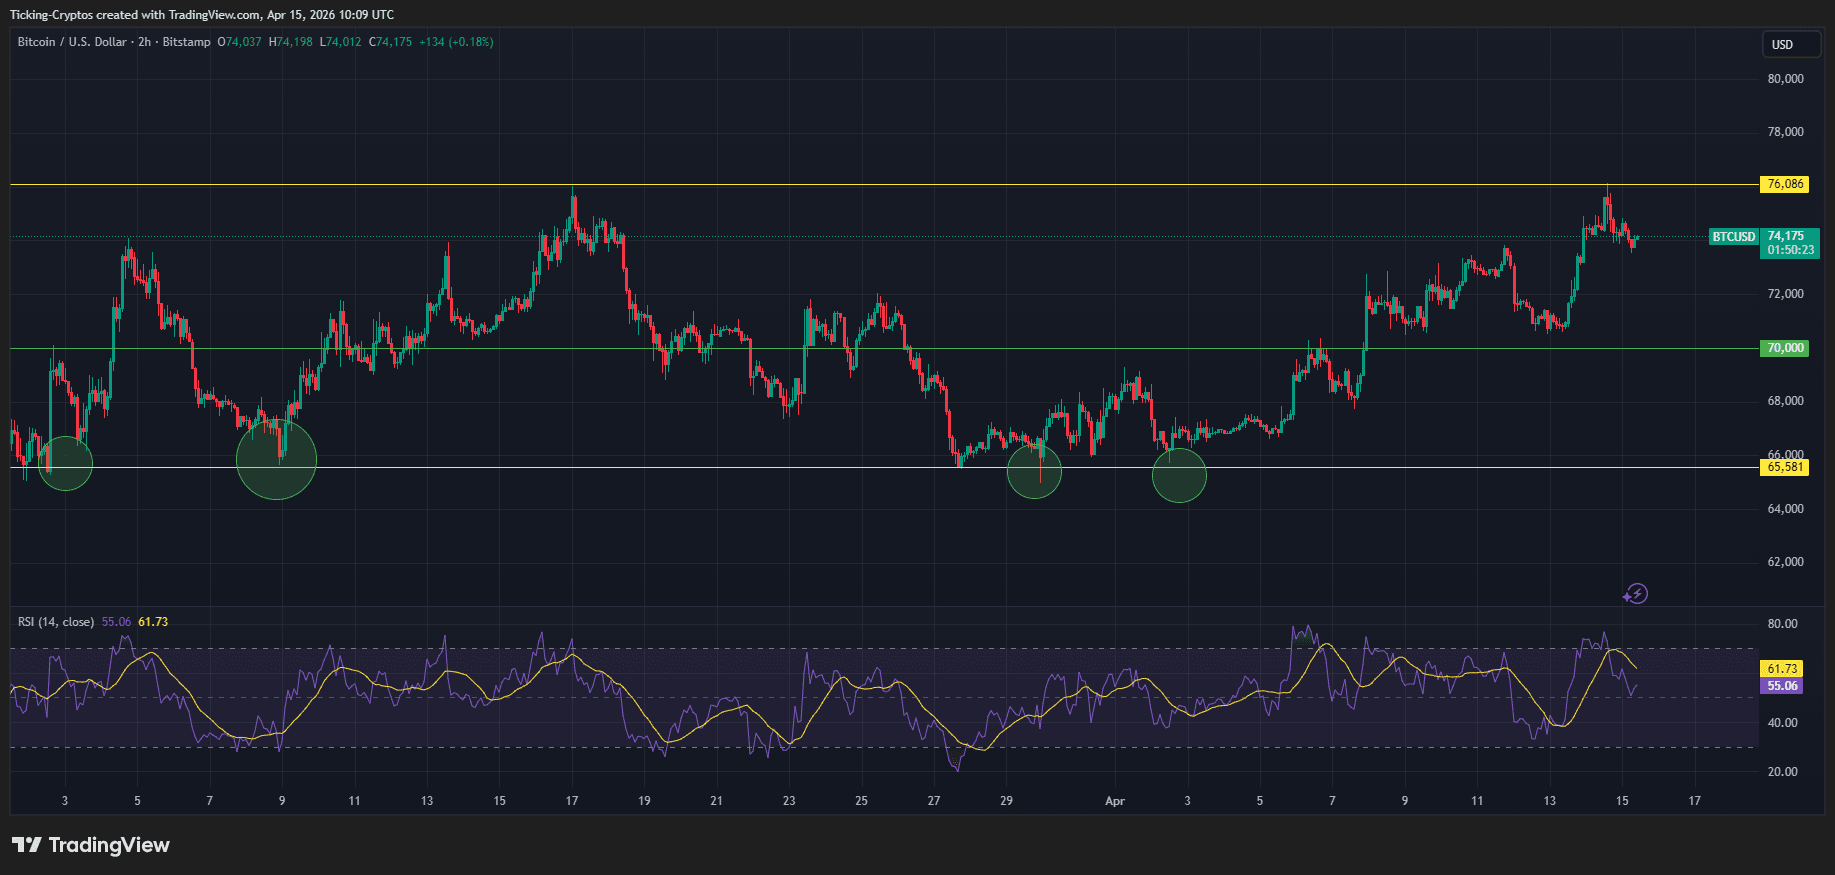
The current consolidation for Bitcoin is occurring between support at $73,300 and resistance at $75,200. Maintaining position above these support levels is vital for preserving a bullish outlook over the medium term.
Navigating Support and Resistance: A Trading Guide
<pGrasping Support and Resistance (S&R) concepts forms the foundation of any effective trading strategy involving Bitcoin.
1. Buying at Support Levels
The Support level represents where buying interest outweighs selling pressure effectively creating a floor on prices. Currently identified major support exists at $73,950 with deeper structural backing around $71,200.
The Strategy: Traders should look out for “bounce” signals when approaching these levels—if $BTC, touches down at approximately $73,300 while gaining volume momentum upwards indicates high-probability conditions for entering long positions.
2. Selling Near Resistance Levels
The Resistance level signifies where selling pressure generally halts upward movements in prices; presently this threshold stands near$75 ,200 followed closely by previous highs reaching up towards$76 ,000 .
The Strategy : It’s common practice among traders setting “Take Profit” orders just beneath these resistance points or initiating “Short” positions if signs suggest rejection (indicated by long upper wicks on candlestick charts) occur near this ceiling.
A Step-by-Step Approach: Simple Strategies For Trading Bitcoin
If you aim to capitalize on current corrections within bitcoin pricing follow this structured method:
- Identify Trend : Utilize daily charts assessing overall trends . Despite recent dips , $ BTC remains positioned above its 100-hourly Simple Moving Average(SMA), indicating sustained bullish momentum .
- Wait For Correction : Avoid impulsive buying driven by fear-of-missing-out(FOMO). Allow time until prices revert back towards known supportive ranges like Fibonacci retracement values set between23 .6%and50%.
- Confirm Using Indicators : Evaluate RSI(Relative Strength Index); readings nearing30suggest oversold conditions while those exceeding70imply overbought scenarios.Currently RSI sits neutrally around50-55providing ample room available both directions regarding potential movement possibilities ahead!
- Set Stop-Losses :</ strong Protect your capital diligently! If purchasing occurs near74 ,000 establish stop-losses slightly below next major supports(e.g.,72 ,500).
- Wait For Correction : Avoid impulsive buying driven by fear-of-missing-out(FOMO). Allow time until prices revert back towards known supportive ranges like Fibonacci retracement values set between23 .6%and50%.
)
)
)
) ) ) )
)
)
)
)
)
)
)
))
)
(
(
(
(
(
(
(
( <
<
<
<
))
))))))))
))))))))))))))))
)))))))))))))((
(((
(((((((((((((
(((((((((((((((
((((((((((())))
((((())))))
((()))
()
()
()
()