In a significant development that solidifies its status as the leading corporate “Bitcoin Treasury,” Strategy Inc. (previously known as MicroStrategy) revealed on Monday that it has purchased an additional 13,927 bitcoins for around $1 billion. This acquisition, detailed in a Form 8-K filing with the Securities and Exchange Commission (SEC) dated April 13, 2026, represents the company’s largest single purchase of this fiscal year.
The transaction was carried out at an average cost of about $71,902 per Bitcoin, which includes all associated fees and expenses. With this latest acquisition of $BTC, Strategy’s total bitcoin holdings have surged to an impressive 780,897 $BTC. To put this into perspective, the company now possesses approximately 3.7% of the total Bitcoin supply capped at 21 million.
The Approach to Bitcoin Acquisition
Bitcoin has recently demonstrated a notable recovery after dipping below $70,000 during Q1 of 2026. For Strategy Inc., their strategy is straightforward: any price drop presents a buying opportunity. The firm showcased its tenacity by achieving a year-to-date yield on Bitcoin investments of 5.6% in 2026.
Interestingly enough, this recent purchase was financed entirely through issuing and selling Series A Perpetual Stretch Preferred Stock between April 6 and April 12 in the same year. Through this at-the-market offering program, Strategy raised net proceeds totaling $1 billion—enabling them to utilize their equity for acquiring what they refer to as “digital gold.”
A Rapid Recovery and Symmetrical Squeeze
An analysis of Bitcoin’s price over a half-hour timeframe indicates a strong recovery following what is termed as a localized “stop-run.” After dropping down to approximately $70,505—a structural support level indicated by green horizontal lines—Bitcoin executed an impressive vertical surge reclaiming levels above $72,000. Currently trading at around $71,755.79,$BTC is consolidating just beneath its next significant resistance point.
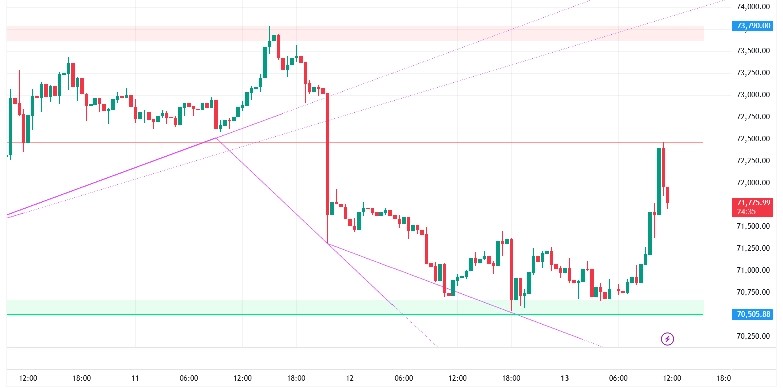
The visual data illustrates that Bitcoin’s price has successfully broken free from descending wedge patterns (highlighted by purple trendlines) and is now utilizing previous resistance levels as dynamic support floors. The recent price movements exhibit stair-step formations where each dip sees aggressive buying activity pushing prices higher.
However,a notable pink zone between $73,790- $74,000 remains intact; representing critical resistance where sellers have previously mounted defenses against upward movement.A substantial close above this range could trigger considerable short-squeezing activity that would effectively dismantle monthly consolidation patterns observed thus far.
The Relative Strength Index (RSI) currently hovers near level58 indicating it has exited oversold conditions; maintaining within ranges between50-65 offers healthy momentum for potential moves towards$74,,000 before hitting overbought limits soon thereafter .
Additonally ,the Volume Profile highlights how pivotal$70 ,500 –$71 ,000has emergedas avalue area demonstrating robust institutional demand .As long astheprice stays abovegreen support zoneshort-term outlookremains bullish .
IfBitcoinsuccessfully breachesand holdsabove$72 ,500resistanceon highvolumefirst major targets become$s73 ,790supplyzone.Reclaimingthislevelwould signalamove towardsthe$76k-$78k rangeasinstitutionalFOMO narrativegathers momentum.Aquickretracementtowards68kstructuralflooris likelyifhorizontal supports failataround70 k5.