Bitcoin is currently priced at approximately $72,400 as the market navigates a tumultuous beginning to the second quarter. Ongoing macroeconomic uncertainties and a fragile ceasefire in the Middle East are contributing to global risk asset volatility. Although $BTC has demonstrated some strength compared to traditional markets in recent weeks, the overall technical outlook remains bearish, indicating that significant resistance lies ahead on its path to recovery.
Analysis of Bitcoin Prices: Daily Chart Overview
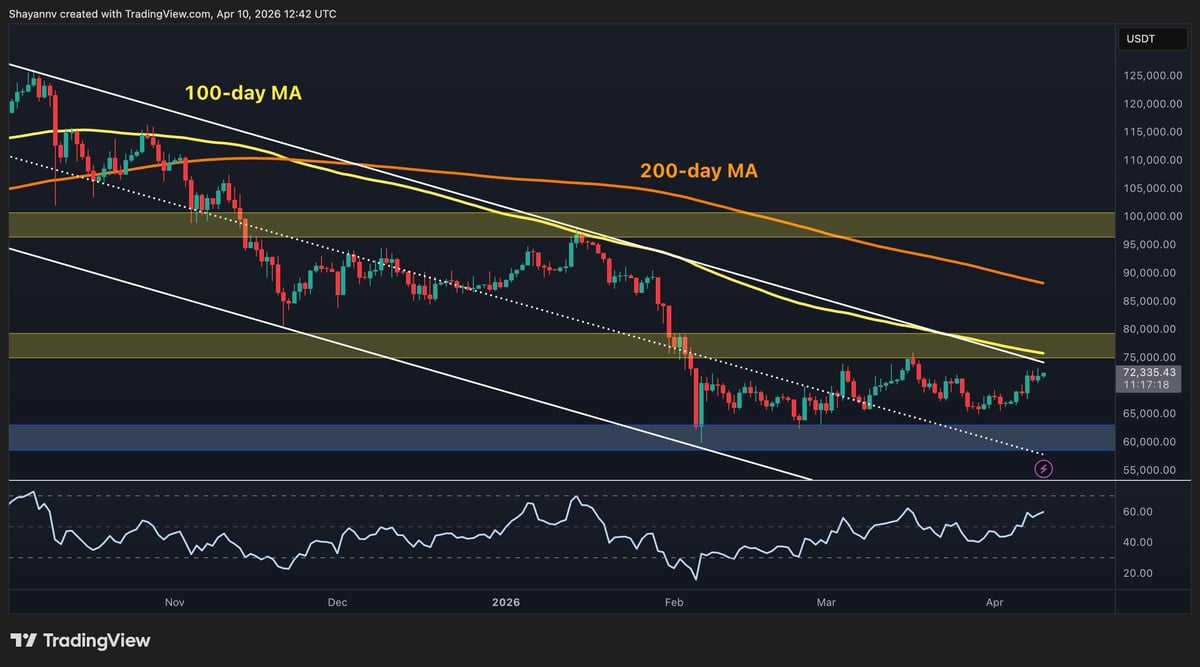
The daily chart reveals that price movements are still confined within a descending channel. Both the 100-day moving average (approximately $75k) and 200-day moving average (around $87k) are declining and positioned above current prices, serving as potential dynamic resistance levels. Additionally, the static resistance zone between $75k and $80k has previously constrained prices back in March; this area coincides with the upper boundary of the channel, making it an even more formidable barrier.
However, it’s worth noting that since hitting lows in March, RSI has been on an upward trajectory and is nearing 60—a positive momentum indicator not seen since before February’s downturn. The critical support level at $60k remains intact; if Bitcoin can break through $75k with strong trading volume while surpassing its 100-day moving average, it would signal a genuine shift in trend direction.
$BTC/USDT Four-Hour Chart Analysis
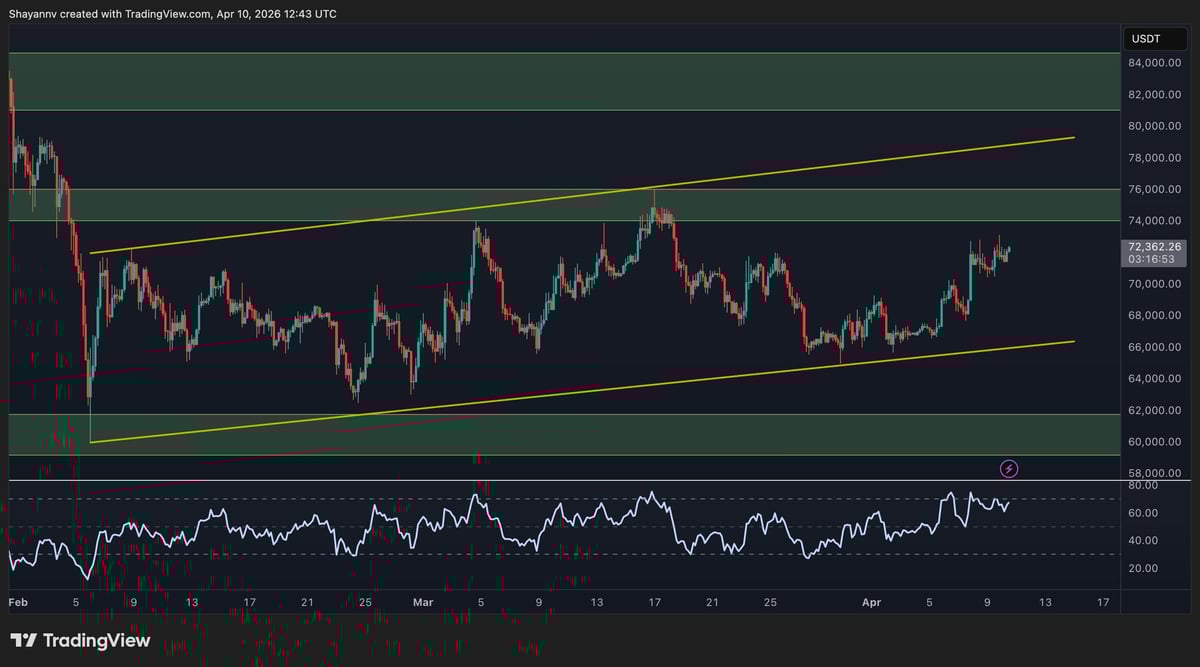
On the four-hour chart timeframe, $BTC has been consolidating within a slightly ascending channel since reaching February lows. This pattern is characterized by higher highs and higher lows established during this period. Currently priced at around $72.4k—situated centrally within this channel—the RSI indicates bullish momentum just shy of overbought territory.
The immediate resistance zone ranging from $74k to $76k represents an initial hurdle for any potential bullish continuation. A confirmed close above this range could serve as a strong short-term bullish signal while potentially accelerating movement toward the upper boundary near the key resistance band around $80K. Conversely, buyers should defend against declines towards lower trendlines situated near levels between approximately $66K–$67K alongside support from around$60K.
Predicting directional movement based solely on technical analysis will be precarious until there’s either breakout or breakdown from these immediate support or resistance levels due largely because geopolitical tensions combined with macroeconomic threats loom larger than they have for quite some time now.
Mood Analysis Among Investors
The Futures Retail Activity indicator presents intriguing signals amid this correction cycle phase observed recently by traders participating actively across futures markets . Following brief appearances indicating “Few Retail” activity clusters near ranges of about ($85-$90) thousand late last year—which historically signaled under-participation—the latest readings show substantial “Many Retail” clusters emerging right where current prices hover ($65-$72). This uptick suggests heightened retail speculative engagement likely driven by anticipation surrounding future price movements
.
This increased participation often occurs mid-trend which may imply $BTC could revisit lower price points flushing out these participants cooling off present conditions further compounded given prevailing resistances faced , hence caution amongst investors remains prudent considering sustained recoveries may not materialize imminently yet .
