On April 8, $BTC is trading at $71,879, experiencing a slight decline from its recent peak of $72,738 reached over the past three weeks. This movement follows an agreement between the US and Iran for a two-week ceasefire. Currently, all four EMAs are positioned above the price level and continue to trend downward; notably, only the 20-day EMA at $69,070 has been reclaimed.
All Four EMAs Remain Above
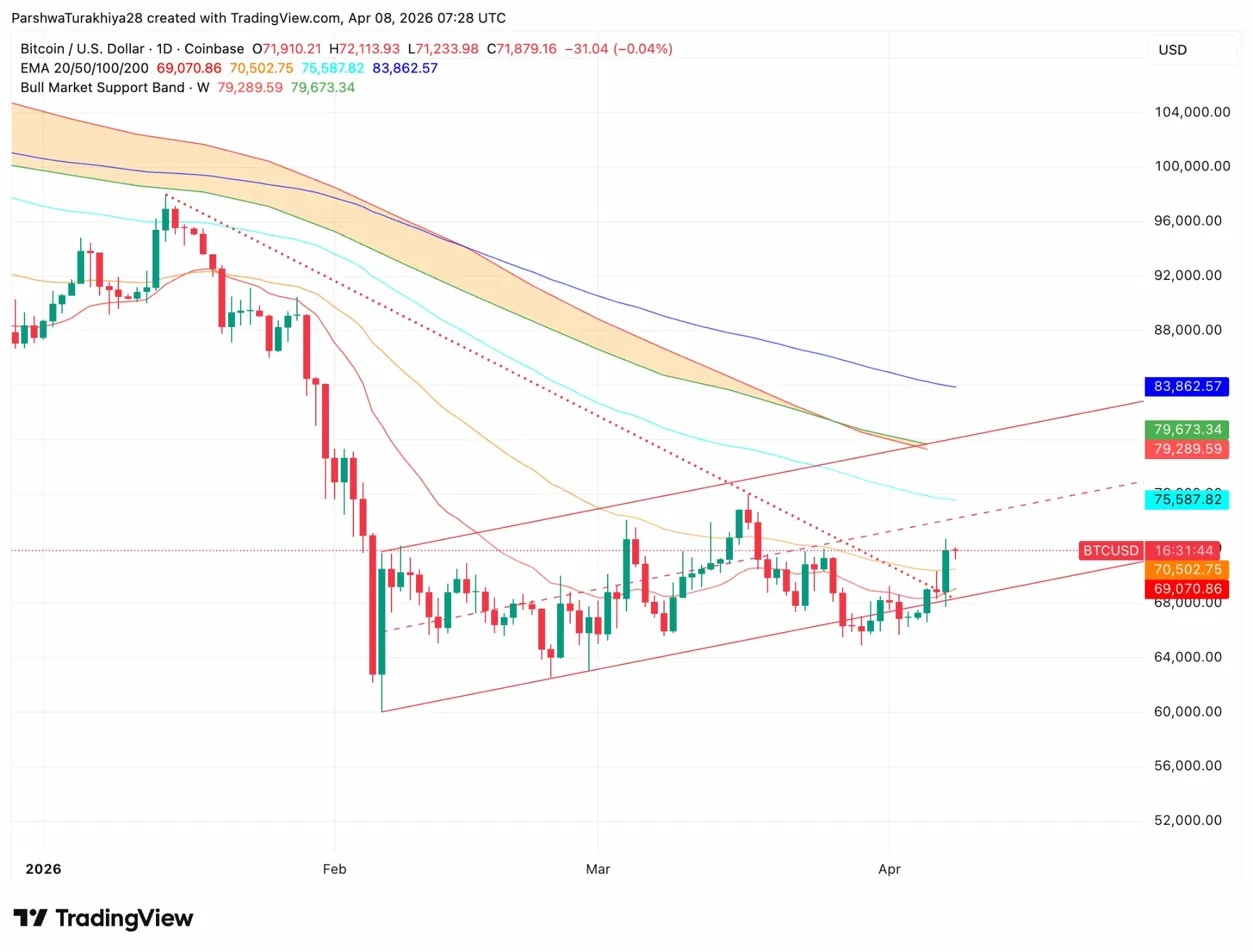
$BTC Daily Price Action (Source: TradingView)
The recent surge allowed $BTC to surpass both the 20-day EMA at $69,070 and the 50-day EMA at $70,502. However, significant resistance remains with the 100-day EMA located at $75,587 and the 200-day EMA at $83,862 still well above current prices. The Bull Market Support Band is situated between $79,289 and $79,673; reclaiming this range would be essential for shifting from a bearish to a bullish daily structure.
Related: Dogecoin Price Prediction: A Majority of Polymarket Bettors Expect DOGE To Close in Positive Territory Today
The upward movement since February’s low near $54K has established several higher lows throughout March; nevertheless each attempt to rise further has faced obstacles before reaching subsequent EMAs. Today’s trading session saw an intraday high of approximately $72K before retracting. A closing price above the critical level of$70K would mark Bitcoin’s first sustained recovery of an EMA since January; however true resistance lies with the upcoming challenge posed by the 100-day EMA around$75K—about five percent higher than current levels.
Critical Levels for $BTC:
20-Day EMA: $69, 070
50-Day EMA: $70, 502
100-Day EMA: $75, 587
Bull Market Support Band: $79, 289 – $$79, 673
200-DayEMA:&$83 ,862
The Ceasefire Impact on Prices
The announcement from President Trump regarding a two-week halt on bombings in Iran led to lower crude oil prices while significantly boosting risk assets across markets.$ BTC surged by4 .9 %to reach& dollar ;72 ,738before settling back down around& dollar ;71 ,879.Ether also experienced gains up to7 .4 %reaching& dollar ;2 ,273during this same rally.
This surge coincides with notable changes in ETF flows as well.Spot Bitcoin ETFs attracted net inflows totaling& dollar ;471 .3Mthis past Monday following last week’s inflowsof& dollar ;22 .3M.This marks a reversal after nearly300 Moutflows recorded previously.The month of March alone saw approximately1 .3Bnet inflows bringing stabilization after four consecutive months marked by outflows beginning November2025.Institutional selling pressure appears to be easing although large-scale conviction buying is yet absent.
& #36 ;215M In Short Liquidations
$ BTC Derivatives Data (Source : Coinglass )
Volume increased significantly by45 .88 %to reach81 .$57Bwhile open interest climbed5 %.18% reaching51 .$40B.New capital influx seems driven largely due tothe ceasefire spike.Options volume soared72 %.16%, hitting6 .$21Bwith options open interest risingby4%.50%up until34 .$17B.
Related : Zcash (ZEC) Price Prediction : Can Bulls Break Through The Barrier At &$329 ?
Currently ,the long-to-short ratio standsat1.&0717slightly favoring longs.In just24 hours shorts incurred losses amountingto215.$08Min liquidations comparedwith30.$58Min losses incurredby longs.This staggering7-to-1ratio confirms thatthe recent movements were indeed fueled by short squeezes.Additionally,the12-hour data supports this narrative showing203.$35Minin short liquidations versus11.$58Minfor longs.Traders who held short positions faced considerable setbacks during this event while open interest continues expanding towards51 .$40Bin comparison againstprevious peaks exceeding80 B+from late2024.
The cryptocurrency analytics firm GreeksLive has evaluated the prevailing market sentiments and their potential implications for Bitcoin as the Federal…