Bitcoin is beginning to show signs of a cautious rebound after successfully maintaining support at the $60,000 mark. Currently, the price hovers around the lower $70,000 range once more. The broader macroeconomic landscape has experienced a slight shift with reports of a temporary ceasefire in the Iran conflict, which had previously impacted risk appetite and commodity markets.
This geopolitical event may alleviate some immediate macroeconomic risks. However, it is important to note that this ceasefire is considered fragile and conditional, with several key issues still unresolved.
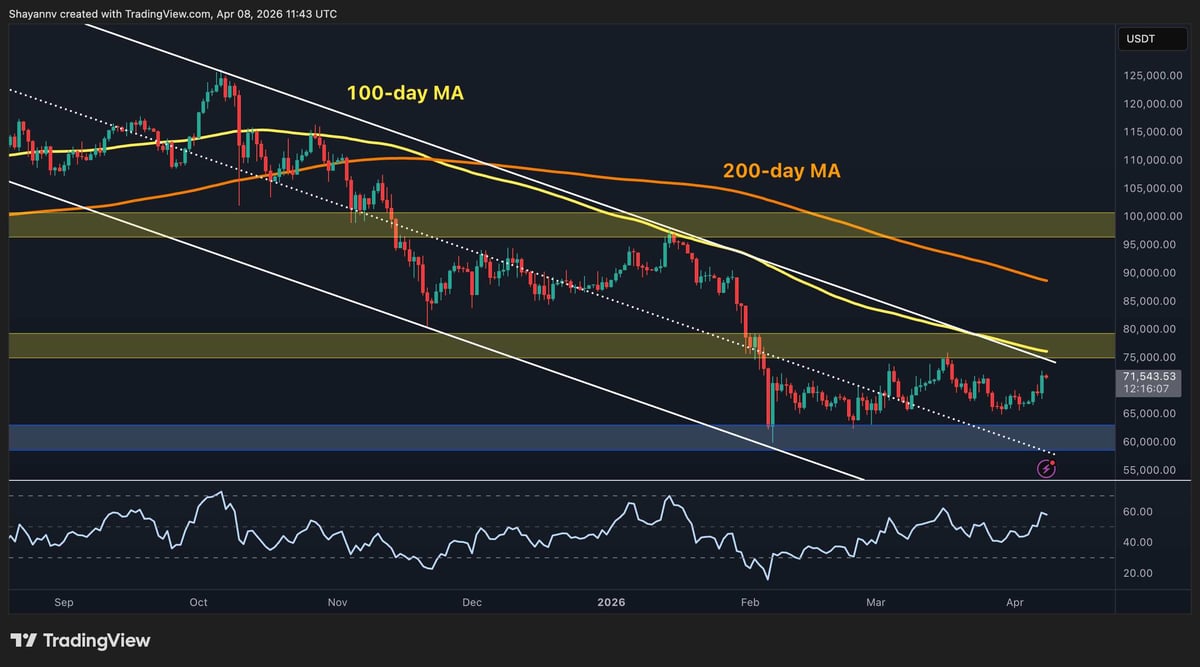
Bitcoin Price Overview: Daily Chart Insights
Examining the daily chart reveals that $BTC continues to be entrenched in a long-term downtrend. This trend is characterized by declining 100-day (~$75k) and 200-day (~$90k) moving averages.
The Relative Strength Index (RSI) indicates bullish momentum as prices approach a retest of the $75k-$80k supply zone. This area coincides with both the upper boundary of an extended descending channel and the 100-day moving average—making it an essential level for traders to monitor closely.
A successful breakout above this critical zone could lead to an upward movement towards testing the 200-day moving average and possibly revisiting levels around $100k. Conversely, if prices are rejected from this resistance area at $75k, we might anticipate another decline toward support at approximately $60k in upcoming weeks.
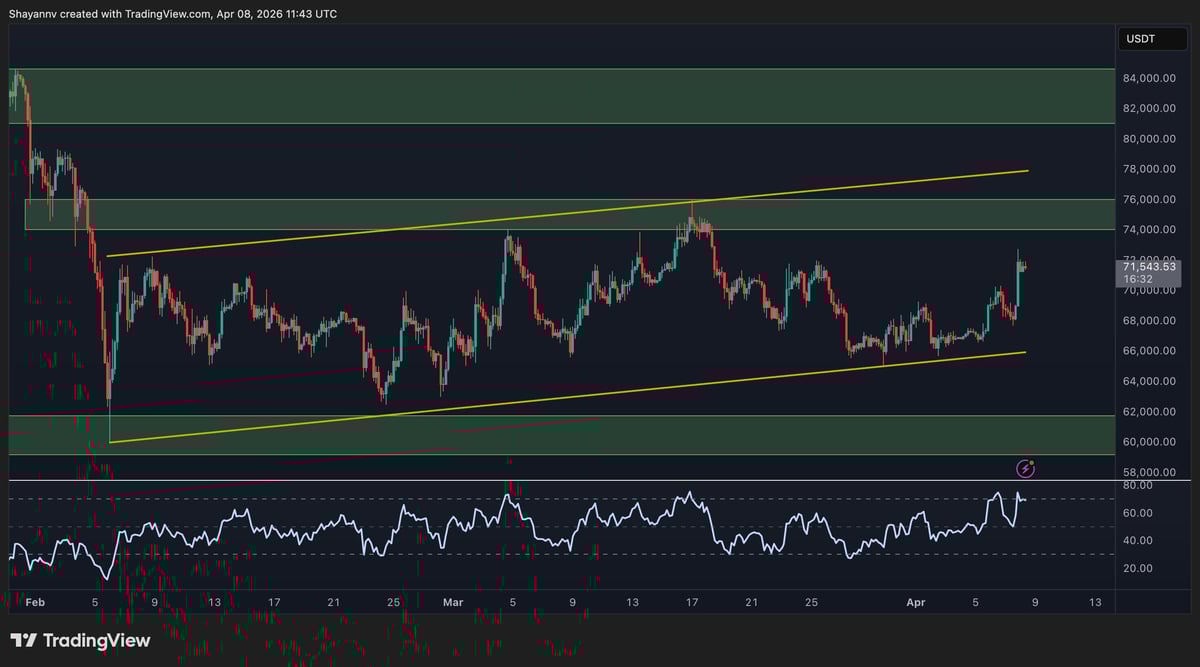
$BTC/USDT Four-Hour Chart Analysis
The four-hour chart illustrates that Bitcoin remains within an ascending channel bounded by approximately $66k on the lower end and near $78k on top. Recently tested lower boundaries have led to rebounds in price action. The internal trend suggests short-term higher highs over recent sessions point towards approaching horizontal resistance at around $75K.
While momentum indicators reflect buyer strength, it’s worth noting that RSI levels are nearing overbought territory; thus market conditions may require additional time before overcoming mentioned resistance levels effectively. Alternatively, failing to reach higher boundaries without rejection could signal potential declines back toward areas near $60K or even further downwards.
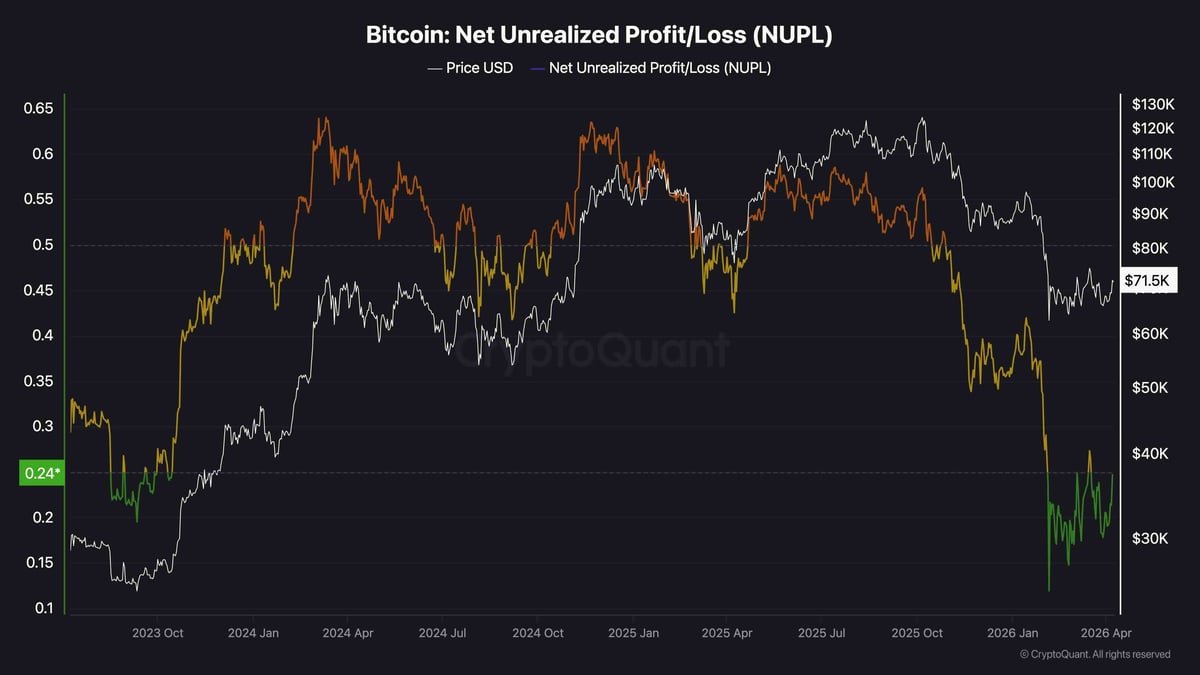
On-Chain Metrics Evaluation
An analysis from an on-chain perspective shows that Net Unrealized Profit/Loss (NUPL) metrics currently reside within low profit-sharing zones akin to those observed during previous significant accumulation phases—indicating many holders aren’t realizing substantial gains yet. This often signifies caution among market participants who have absorbed prior downturns without indulging in renewed speculative excesses.
This backdrop might foster choppier consolidation rather than triggering sustained sell-offs; however should prices start forming higher highs alongside lows soon enough—it could imply heavy accumulation taking place now setting up favorable conditions for sustainable recovery as months progress ahead!