In summary
Trump has issued a deadline of 8 p.m. ET for Iran to reopen the Strait of Hormuz, threatening severe consequences if they do not comply. This announcement has caused market fluctuations, with Bitcoin experiencing a 2% decline to $68,117 and showing signs of a potential breakdown on its daily chart. Traders in prediction markets are estimating that there is a 57% likelihood that Bitcoin will drop to $55K.
The current situation is dominated by the threat of war.
This morning, President Donald Trump took to Truth Social and warned that “a whole civilization will die tonight” unless Iran capitulates to U.S. demands. He emphasized an ultimatum: by 8 p.m. ET, Iran must reopen the Strait of Hormuz or face dire consequences.
pic.twitter.com/5qOokIQPuK
— Rapid Response 47 (@RapidResponse47) April 7, 2026
S&P 500 futures fell by 0.4%, Nasdaq futures decreased by 0.6%, and Dow futures dropped by 142 points before trading commenced today. Conversely, oil prices surged; WTI crude exceeded $115 per barrel while Brent surpassed $110—a staggering increase exceeding 70% over the past month—largely due to disruptions in the Strait of Hormuz which have been affecting about one-fifth of global oil supply since late February.
There it is—Dated Brent (i.e., spot) crude hits $144.46/bbl, a new all-time high.
— Rory Johnston (@Rory_Johnston) April 7, 2026
Iran has dismissed an earlier ceasefire proposal from the United States; international organizations like the International Committee of the Red Cross have indicated that Trump’s threats could potentially be classified as “war crimes” if acted upon.
The heightened tensions are causing anxiety across financial markets—including cryptocurrencies like Bitcoin—which fell to $68,557 today (down by approximately two percent), while Ethereum saw a decrease of about two point seven percent as traders brace for possible further unrest in response to military actions against civilian targets tonight; historically speaking, Bitcoin has not proven itself as a safe haven asset during times of conflict.
A prediction market known as Myriad suggests traders believe there’s only a slim chance (24%) that Iran’s regime will collapse before October this year; this indicates expectations for either another unexpected move from Trump or an extended conflict without resolution anticipated well into later months this year.
The patterns suggest caution for Bitcoin investors
Bitcoin’s recent decline appears manageable at first glance with just under two percent drop today—but examining longer-term trends reveals more concerning indicators ahead.
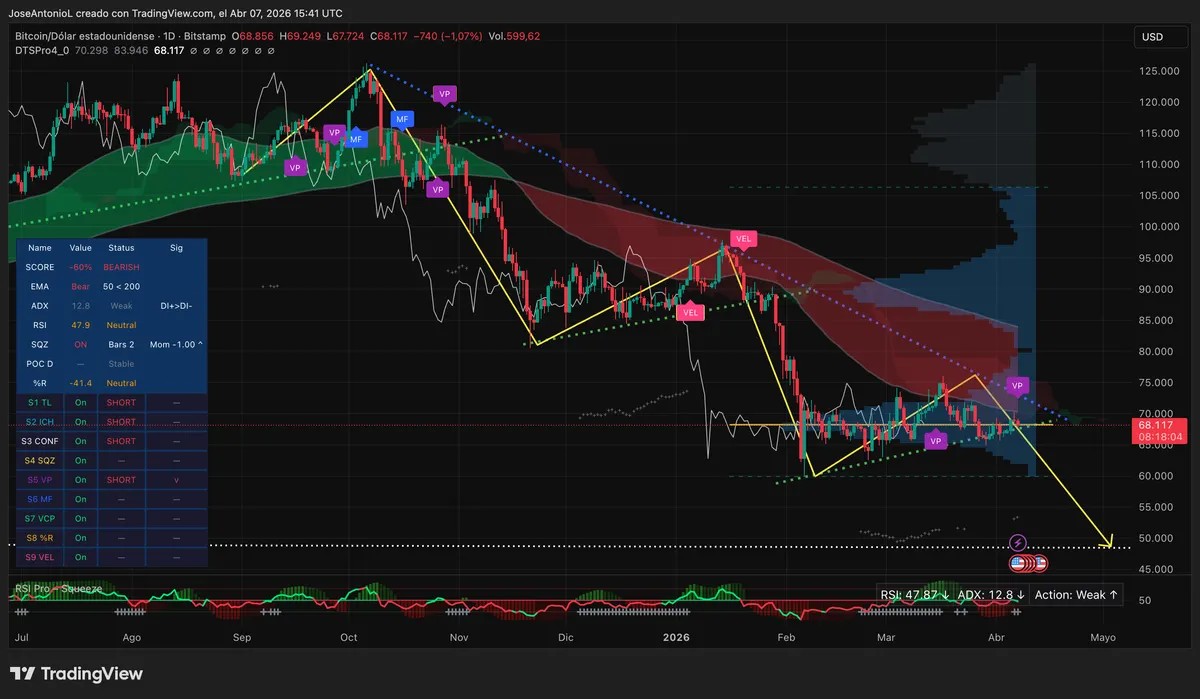
The daily charts indicate three distinct attempts made by buyers trying unsuccessfully recover losses following significant peaks since last October—with each recovery failing at lower highs than previous attempts while also marking lower lows during breakdowns thereafter.Because Q1 ended up being its worst quarter since back in ’18 when it lost around twenty-two percent amid wars tariffs along with aggressive Federal Reserve policies weighing heavily on risk appetite—the cryptocurrency now finds itself teetering near support levels around sixty-five thousand dollars.If historical patterns repeat themselves here then we might see another plunge downwards towards fifty-five thousand dollars or worse yet again soon enough!
This overall sentiment amongst bitcoin traders remains bearish according various indicators currently available too!
The Exponential Moving Averages show how significantly bearish signals arise given their configuration where recently observed figures reveal how much weaker our short-term averages remain compared against longer ones indicating ongoing downward pressure still persists without any structural reversals appearing thus far!When such configurations occur among these moving averages they often refer colloquially referred-to death crosses which typically lead rallies being sold off instead!
A solid resistance level marked out previously via fifty-day EMA holds firm ever since appearing back late last year too!
An Average Directional Index reading shows us sitting low at twelve-point-eight meaning below twenty thresholds indicating real trends forming aren’t present right now either!This measure tracks strength regardless directionality so having numbers under twenty means choppy conditions prevail instead.The bears may hold control theoretically but actual momentum hasn’t kicked fully into gear yet judging sideways movements following major drops witnessed back February!”
For bullish advocates however there exists some silver lining amidst gloominess surrounding low ADX suggesting potential trend reversal possibilities exist provided confirmation arises elsewhere too—but nothing substantial materializing presently leaves room doubt hanging overhead still !
Relative Strength Index reads forty-seven point nine implying neutrality although edging slightly oversold territory ;this metric gauges buying/selling momentum dynamics hence neither side holds clear advantage presently .Meanwhile Squeeze Momentum Indicator illustrates compressed energy building up within market ,currently leaning negative -suggesting impending squeeze release accompanied downward pressures create bearish setups overall .
Mood swings ahead?
Charts depict likelihood pointing downwards rather than upwards based upon three identical yellow patterns observed alongside failed recoveries seen throughout recent history ! $BTC has consistently formed lower highs every single time prior breaking through supports discovering new floors subsequently.The descending blue trendline connecting those peaks remains intact whilst Ichimoku cloud looming above appears deep red signaling ceiling rather floor altogether here !
If price closes beneath sixty-five thousand ,it would serve major confirmation pattern opening pathway leading towards fifty-five grand subsequently without much structural support lying between them .On Myriad platform trader sentiments echo similar thoughts :57 % chance identified predicting $BTC ’s next significant movement results dump reaching five hundred grand compared thirty-three odds favoring upward push hitting eighty-four k instead.A separate inquiry seeks gauge whether crypto can bloom springtime ;66 % respondents affirm no possibility remaining until May thirty-first deadline approaches swiftly ! A valid argument exists opposing viewpoint nonetheless :Bitcoin plummeted over forty-five percentage points relative previous all-time peak recorded last October standing tall one hundred twenty-six k mark some analysts including Main Management’s Kim Arthur deem phase bottoming classic four-year cycle winter phenomenon occurring within crypto landscape right now.” But bulls require genuine confirmations beforehand witnessing breakouts surpass seventy-five-thousand dollar mark convincingly along ADX climbing above threshold value signalling authentic trends developing emerging finally culminating turning fifty-day EMA curling upward toward two-hundred day average once again—all elements missing currently prevent bounces resembling mere formations setting up further declines ahead ultimately.” Disclaimer: The opinions expressed herein solely represent author’s perspective intended purely informational purposes lacking any form financial investment advice whatsoever offered herein whatsoever included therein explicitly stated disclaimer accompanying message transmitted hereby contained within text presented forthwith.