The leading cryptocurrency, Bitcoin, experienced a period of stability on Saturday, March 4th, with its price hovering around $67,000. Such minimal fluctuations are typical during weekends when institutional investors from traditional markets are inactive. However, recent on-chain data reveals that Bitcoin’s network activity has plummeted to unprecedented lows. Analysts view this as a potential indicator for market stabilization. Could Bitcoin be poised to reclaim the $70,000 threshold?
$BTC Network Activity Hits Record Lows as RVTS Ratio Peaks
Recent analysis of the Bitcoin blockchain has shown that the 28-day RVTS ratio is at its highest since tracking began. This metric compares the market value of the cryptocurrency against its adjusted economic volume and indicates a notable decrease in value flow through network nodes.
This decline signifies one of the least active periods for ledger usage in Bitcoin’s history due to significantly reduced adjusted volume figures used for these calculations.
Historical patterns from previous Bitcoin cycles suggest that similar peaks in this ratio occurred around cycle troughs in 2012, 2015, 2019, and 2022. These trends were also observed during local lows within extended bull or bear markets.
The current situation arises within a trading environment heavily influenced by derivative markets and liquidity injection strategies rather than traditional base-layer transactions. Consequently, these shifts have led to decreased participation across the network.
Bitcoin Price Nears Major Resistance Level
In recent months, Bitcoin’s price has shown gradual recovery from $59,930 to its current level of approximately $67,410—a rise of about 12.6%. Alongside this price movement, momentum indicators like the relative strength index (RSI) have increased to around 45%, indicating a slowdown in corrective pressure.
Despite an uptick in daily RSI readings suggesting bullish momentum may be building up again after prior declines; actual price movements remain subdued with buyers struggling to make significant advances. Notably though—this latest increase is characterized as part of a new bullish cycle forming within a descending channel pattern seen on daily charts.
Since August 2025 onward—the coin’s pricing dynamics have been actively oscillating between two descending trendlines which serve as dynamic resistance and support levels against buyer activity. Currently priced at approximately $67,270—Bitcoin stands just about 5.3% away from testing resistance along this channel pattern’s upper trendline; such retests could determine $BTC‘s immediate trajectory moving forward.
If sellers manage effectively defend their position at this dynamic resistance level—the coin could potentially revert back towards nearby support levels situated at $62:500 followed by further downwards pressure targeting around$57:500 thereafter .
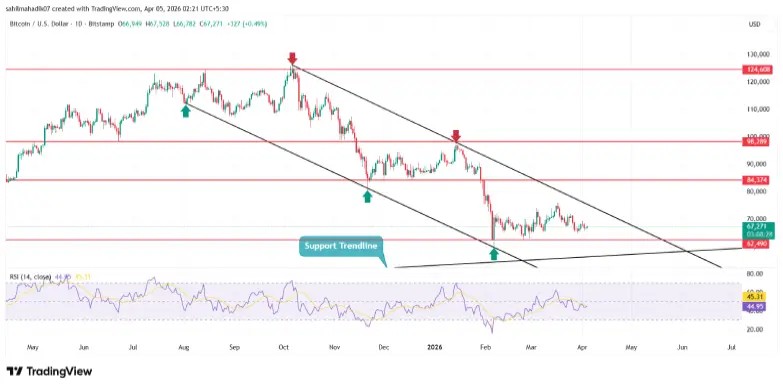
<pConversely , if there occurs an upward breakout beyond established resistances , it would reinvigorate recovery efforts pushing prices above key psychological barriers such as$70k mark .