Bitcoin is currently trading just above a previously broken support level at $66,900, as a potential bearish flag pattern emerges on the 4-hour chart. The daily MACD has reached one of its lowest points in this cycle, increasing the likelihood of a decline towards $63,000 as we approach the low-liquidity Good Friday weekend.
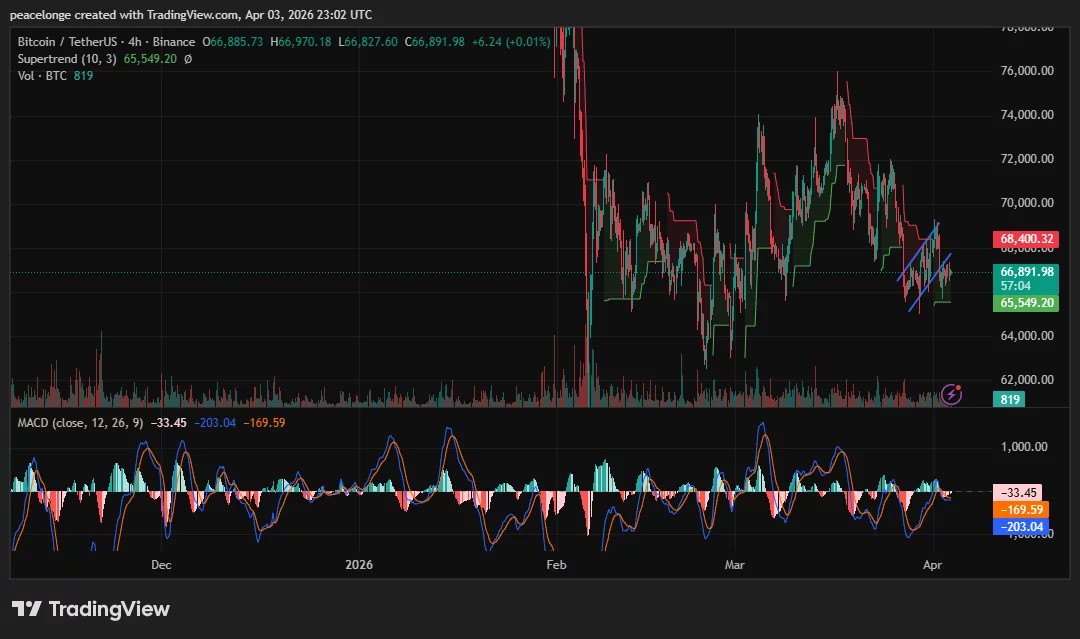
As of April 3, 2026, Bitcoin (BTC) is priced at $66,891. This marks a slight recovery above what was once seen as horizontal support at $66,188 after experiencing a drop from March’s peak near $76,000. The daily Supertrend indicator indicates resistance at approximately $74,093—significantly higher than current prices—reinforcing the prevailing bearish trend. Notably, there was a significant spike in volume during this recent downturn which suggests forced selling rather than typical market distribution.
The 4-hour chart reveals that since hitting an intraday low recently, Bitcoin has formed a small ascending channel with its current close around $66,891 resting just above the Supertrend support level of $65,549 on this timeframe. While this short-term structure may appear somewhat positive on the 4-hour chart; it exists within an overarching downtrend that raises concerns about it being merely a bear flag instead of an actual reversal.
Bear Flag Formation and Indicator Analysis
A bear flag represents a brief and shallow recovery occurring within an ongoing downtrend before another downward movement ensues. The ascending channel observed in Bitcoin’s 4-hour chart aligns with this definition: prices are recovering slightly while maintaining negative momentum; specifically noted by MACD histogram readings remaining deeply negative at -169 and MACD line reading -203 against its signal line at -33. There are no signs of bullish crossover on the MACD for this timeframe; moreover,the histogram continues to widen into negative territory.
The daily chart presents even more severe MACD readings: here we see values for the MACD line standing at -862 compared to its signal line reading -223 resulting in an extreme histogram value of -639. According to Investtech’s technical evaluation dated April 3rd , Bitcoin “has breached below key levels within its rising trend channel” along with breaking through critical support located around $67 ,300 suggesting “this indicates further declines ahead.” Both moving averages—the 50-day SMA near approximately$69 ,089 and200-day SMA roughly$70 ,280—are positioned above current price levels indicating stacked resistance against any attempts for recovery.
Critical Levels and Price Projections
The immediate support can be found around$65 ,549 which corresponds to present readings fromthe four hour Supertrend indicator . A closure belowthis threshold could hasten movements towardsthe next majorsupport zone between$63 ,000-$64 ,000 basedon historical price actionfrom early2026 .Should there be adeeper breakdownbelow$60 ,490 targets would shift towardsan estimatedlevelofaround54Kaccordingto technicalanalysisprovidedbyCoinDCX .
Onthe upside,resistance now existsatwhatwaspreviouslyknownasbrokenlevelof$66 ,188whichhas flippedto becomea newresistance point.The upper limitofthisascendingchannelnear68,400alsoalignswiththebearishSupertrendorlineandservesasthefirstsignificantceiling.Aconfirmedcloseabove68,400wouldinvalidatebearflagexpectationsandpotentiallyinitiateareliefrallytowards70K。
Options Expiry Contextualized Within Market Dynamics
Around27 ,600Bitcoinoptionscontracts expiredonApril3withanotionalvalueapproachingapproximately1。8billionandamaxpainpointsetat68kaccordingtoCoinglassdata.Theput/callratiohoveringaround0。55indicatesalightbiasinfavorofcallsoverputsexpiringbutgivenpriceactionbelowmaxpainitbecomeschallengingforoptionsdrivenbouncesduringthistimeframe。
Citingcrypto.news reports,Bitcoin experiencedadeclineexceeding4%down toabout66,250onApril2due toenvironmental factors suchas escalatingU.S.-Iran tensions pushingoilpricesabovethe100markresultinginmorethan420millioninliquidationsacrossmarkets.CMEfuturesarenotoperatingtodayduetoGoodFridaywhichremovesinstitutionaldemandalongwithliquidityduringcriticalperiods。
The research teamfromCoinDCXhighlightedthat“sustainedclosingabove67,500supportzone”isessentialforany5-7%recoverytargetingtoward72Kremainingplausible.FailuretoreclaimthatthresholdintothefollowingweekcombinedwithnegativeMACDsuggeststhat63krepresentsmostlikelynextdirectionaltargetmovingforward。