
The recent fluctuations in Bitcoin’s price have been quite challenging for investors. For several months, the market has experienced a sideways to downward trend, resulting in a series of bearish monthly closes since October that have left many crypto enthusiasts feeling anxious. This gradual decline often feels more distressing than sudden sell-offs.
A cryptocurrency analyst suggests that rather than viewing this current phase as an indication of further declines, historical patterns indicate that Bitcoin is much closer to a significant turnaround than most traders might think.
Drawing Parallels with 2018: Six Consecutive Red Candles Followed by a Major Upsurge
“In light of the prevailing fear, now may be an opportune time to buy,” remarked the analyst, suggesting that Bitcoin could potentially reach new all-time highs following this downturn. The evidence they reference dates back to late 2018 and early 2019—the only other instance where Bitcoin recorded six consecutive red monthly candles.
This timeframe between late 2018 and early 2019 serves as one of the most enlightening episodes in Bitcoin’s pricing history; what transpired next significantly altered the trajectory of its market cycle.
From August 2018 until January 2019, Bitcoin closed six straight red monthly candles during a decline from around $7,700 down to approximately $3,500. Investor sentiment had plummeted completely; retail participants largely capitulated while onlookers perceived the price movement as fundamentally broken.
However, contrary to appearances at that time, these six months effectively eliminated weaker hands from the market and absorbed ongoing selling pressure—quietly establishing a foundation for what was about to unfold. By May 2019, Bitcoin surged nearly threefold from its cycle lows up to almost $10,500. By June it was nearing $13,000—a remarkable increase exceeding four times its lowest point during those declining months.
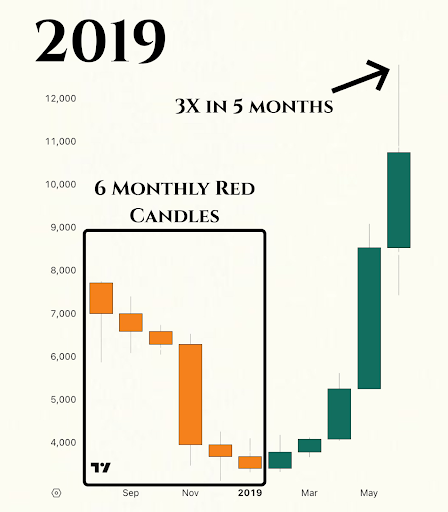
Bitcoin Price Chart. Source: @ourcryptotalk On X
A Recognizable Trend Amidst A Different Market Environment
The current behavior of Bitcoin’s price shares some similarities with past patterns but is not identical. The ongoing price action resembles aspects of the structure seen in late-2018 through early-2019; however it exists within a more favorable context today.
Since October 2025 onwards,Bitcoin’s string of red monthly candles has seen prices drop from over $126K down below $70K—a controlled retreat amounting to over a staggering drop greater than forty-five percent from its peak value—painful by typical standards yet measured against historical drawdowns within cryptocurrency markets seems less alarming.
The analyst points out that although these candles are indeed red they lack impulsiveness; there is no panic-driven selling but rather steady pressure being absorbed gradually over time. While retail sentiment has waned throughout this prolonged downturn institutional buyers appear unfazed—moving counterintuitively towards accumulation instead—with Strategy (the largest corporate holder) amassing more than 122K BTC.
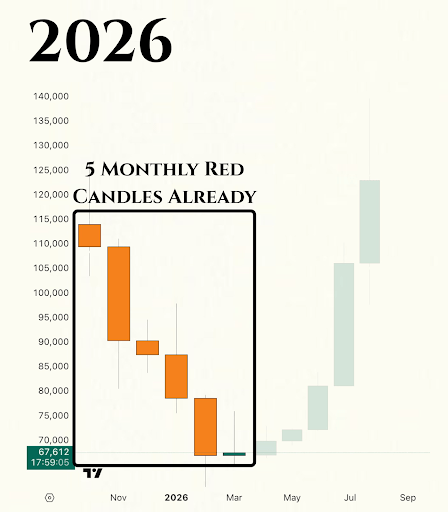
Bitcoin Price Chart.Source:@ourcryptotalk On X
If we apply insights drawn from recovery trends observed back in $BTC ‘s resurgence then potential gains ranging between threefold or fourfold off recent lows could see values rise anywhere between $180k-$250k . Even under conservative estimates projecting two-fold recoveries based on figures around $67k would place prices above previous records at levels exceeding $130k