
The price of Bitcoin has experienced a remarkable rebound in the last day, currently valued at $67,455, which marks a 1.4% increase within the trading session. This upward movement offers a brief respite from the previous week’s decline of 1.3%. Despite facing short-term fluctuations, $BTC maintains its fundamental strength with an overall monthly gain of 5.3%.
Trader activity has surged as $BTC recorded a trading volume of $31.33 billion over the past twenty-four hours. The critical question remains how Bitcoin will respond to ongoing geopolitical tensions and global economic instability.
Warning Signs from Institutional Outflows
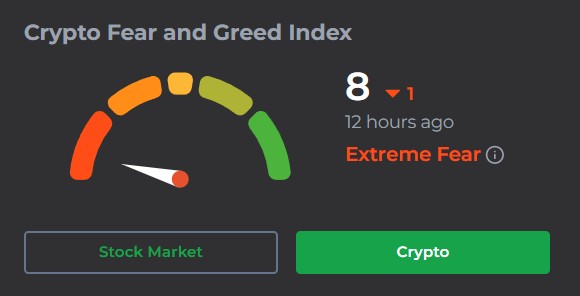
The global market is under significant strain, with uncertainty looming large for both retail and institutional investors alike. The Crypto Fear and Greed Index has plummeted to an alarming level of 8, indicating extreme fear in the market environment. Historically, such low readings often lead traders to liquidate their holdings in order to safeguard their capital.
A further indication of this trend can be seen in daily spot ETF outflows; on March 27th alone, Bitcoin ETFs experienced net outflows totaling $225.48 million—BlackRock’s IBIT ETF was responsible for a staggering net outflow of $201.5 million by itself.
This exodus suggests that traditional financial investors are reducing risk exposure by moving away from volatile assets towards more stable investments.
An Analysis of Bitcoin’s Price Chart
A look at the fifteen-minute price chart for Bitcoin reveals an assertive move by bullish traders characterized by what appears to be a liquidity sweep strategy. Previously, Bitcoin had encountered difficulties as it fell through a descending triangle pattern toward the psychological support level around $65,000; however, rather than signaling capitulation among sellers, this drop acted as bait for liquidity seekers.
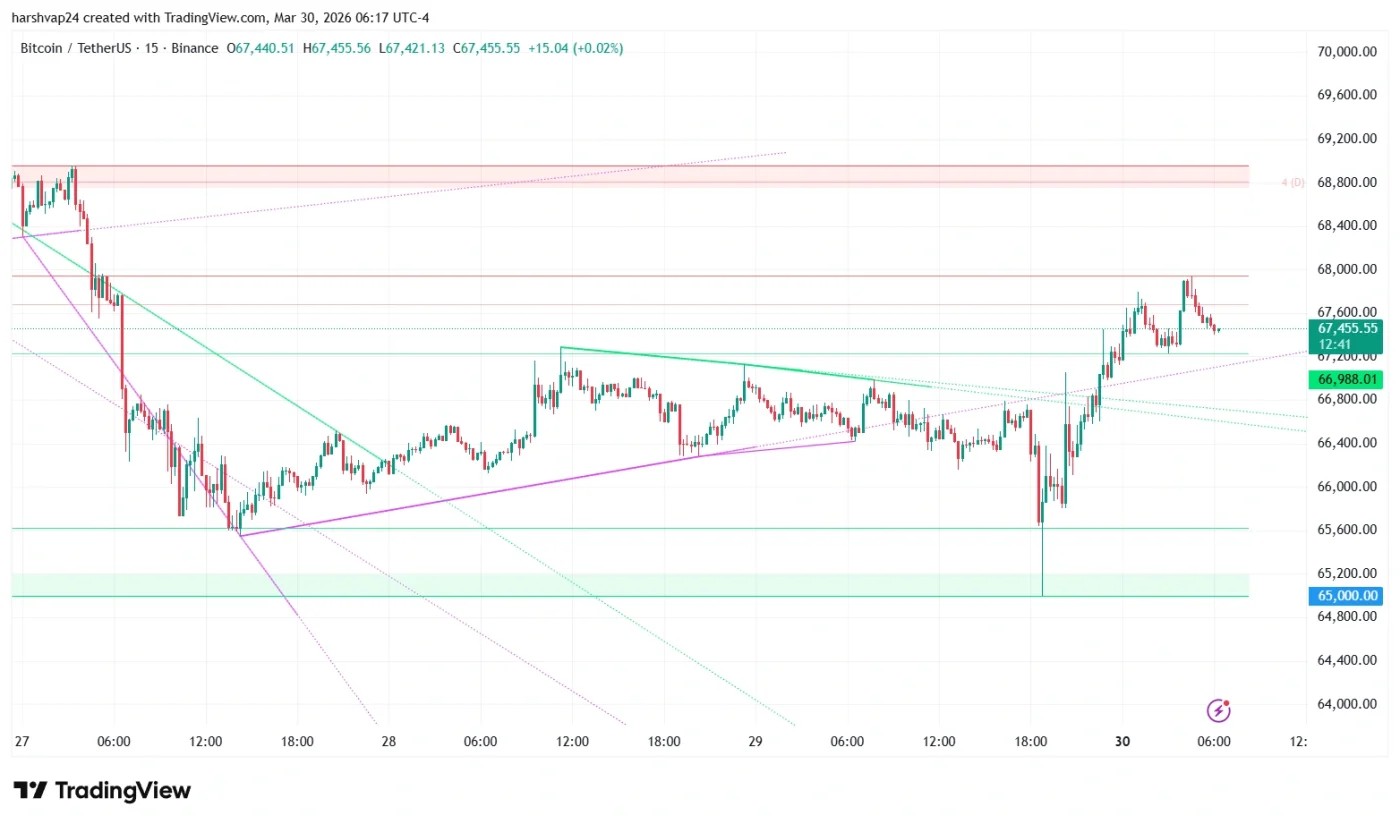
Bullish buyers entered aggressively at the $65,000 support floor and triggered a V-shaped recovery that reversed prior bearish momentum trends successfully breaking above resistance levels that had previously hindered upward movement.
This sudden surge has prompted Exponential Moving Averages (EMAs) to shift from bearish signals towards bullish ones; specifically,the short-term moving averages (5-, 9-, and 12-period) have crossed above longer-term averages (21-,50-,and200-period), indicating potential changes in intraday momentum dynamics.
The Future Trajectory for $BTC
The current market finds itself navigating between significant institutional ETF outflows while simultaneously experiencing budding bullish momentum trends . Buyers should monitor whether Bitcoin can maintain its position above$67 ,000 before making any trades ; if successful ,the next logical resistance point would likely be around$68 ,800 .
Sellers may rely on extreme fear indicators as justification for potential downward movements . Should this recent V-shaped recovery turn out merely temporary—a dead-cat bounce or short-covering rally—then $ BTC could potentially retrace back down into liquidity pools near$65 ,000 zone .