On March 29, 2026, at approximately 9 a.m. Eastern Time, Bitcoin was valued at $66,759. The prominent cryptocurrency fluctuated within a range of $66,266 to $67,185 over the past 24 hours. As $BTC hovered close to short-term support levels, broader technical indicators exhibited mixed signals and trend strength appeared subdued. The market capitalization reached $1.33 trillion with a trading volume of $23.11 billion in the last day, indicating active yet uncertain participation.
Bitcoin Chart Analysis
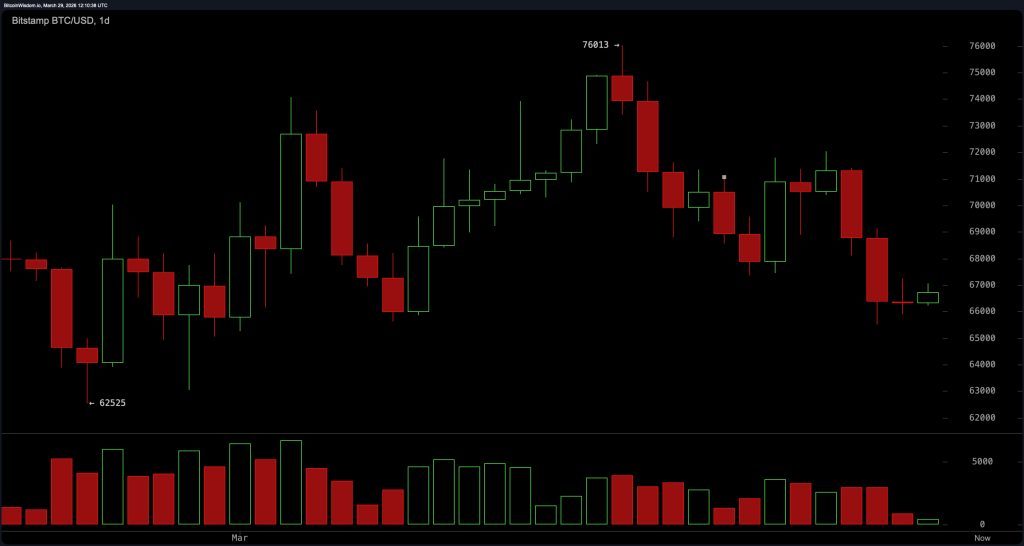
The daily chart for Bitcoin indicated a weakening pattern after encountering resistance near the $76,000 mark and subsequently forming lower highs. Prices have stabilized in the range of $66,000 to $67,000 while remaining just above a soft support zone.
The heightened trading volume during this decline suggested distribution rather than merely a minor pullback which reinforced an overall bearish-neutral sentiment in the market. A significant shift would require prices to rise back toward the $70,000 level; however downside risks remain towards levels around $65,000 and potentially down to about $62,500.
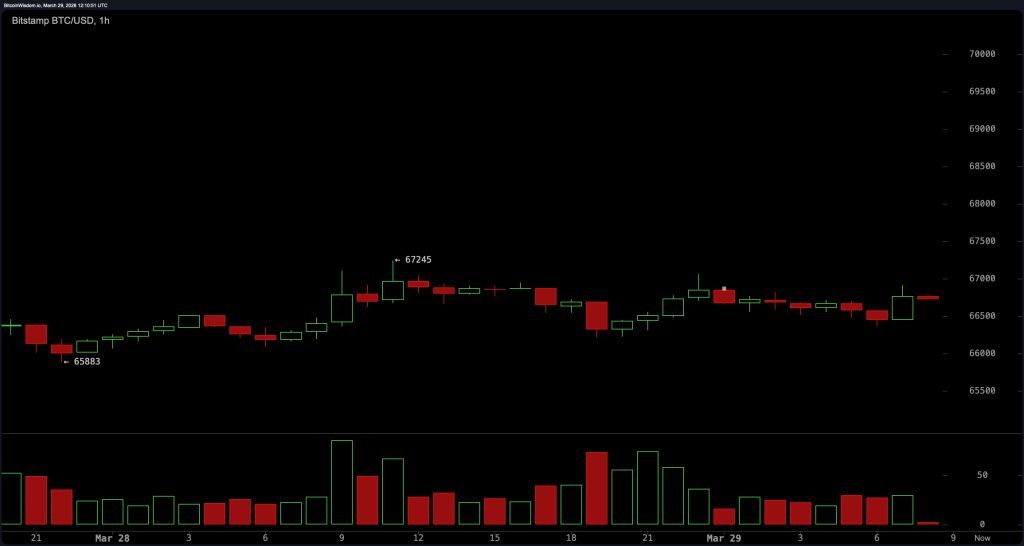
Looking at the hourly chart for Bitcoin reveals that price movements have tightened into a narrow consolidation phase characterized by smaller candlesticks and decreasing volume levels. This compression reflects uncertainty in short-term direction; however slight upward movement has resulted in marginally higher lows being established. Immediate intraday support is seen between approximately $65,800 and $66,000 while resistance is found between roughly$67 ,000 and$67 ,500 . This structure suggests potential for breakout but remains ambiguous due to wider market conditions.
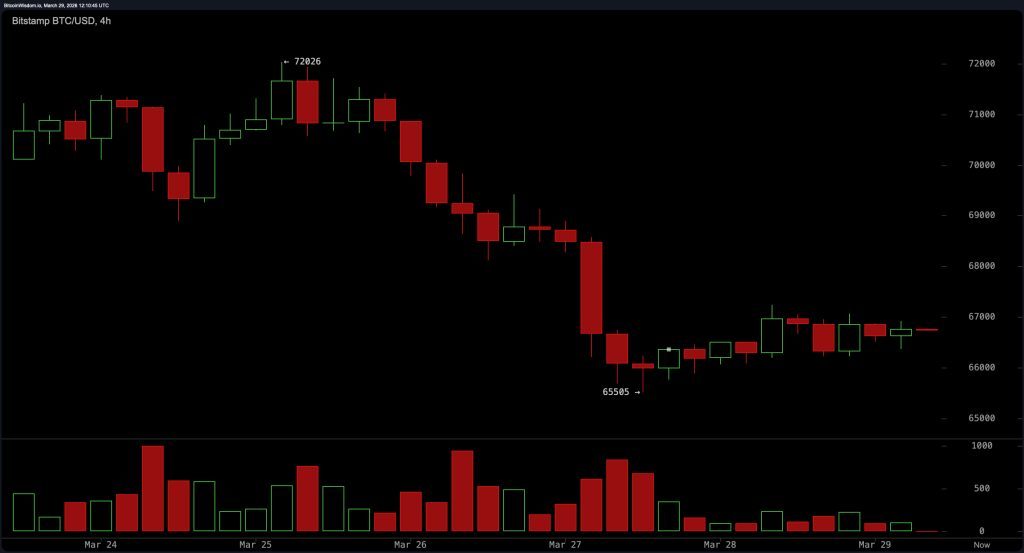
The four-hour timeframe indicates that Bitcoin has shifted from an intense sell-off into early-stage consolidation patterns where it has established support around$65 ,500and resistance ranging from$67 ,500to68 ,000 . Momentum appears stabilizing as selling pressure diminishes though not entirely reversing course yet . This behavior within defined ranges signifies more of pause rather than confirmed reversal as traders await decisive moves beyond these established boundaries.
Oscillators indicate that there’s currently no alignment within this market environment: The relative strength index (RSI) stands neutral at42while Stochastic oscillator approaches oversold territory without confirmation sitting at nine.The commodity channel index (CCI) shows statistically stretched downside conditions reading −158while momentum measures−3,157suggest possible stabilization ahead.
Nevertheless,the average directional index(ADX) registers weak trend strength measuring16,the Awesome oscillator stays negative recording−923and moving average convergence divergence(MACD) continues signaling bearish pressure with its value being−721。
Moving averages(MAs ) emphasize prevailing weakness across all major periods since both exponential moving averages(EMAs )and simple moving averages(SMAs )remain positioned above current prices indicating sustained downward pressure.Short-term benchmarks include10EMAat68,534and10SMAat68 ,817—both exceeding present values.
Medium-range resistances appear marked by20EMAat69 ,230and20SMAat70 ,192whereas long-term indicators such as100EMAat77 ,137and200SMAaround91,072highlight significant gaps existing within overarching trends collectively reflecting markets operating below crucial benchmarks lacking immediate reclaim prospects.
Bullish Perspective:
Bitcoin remains compressed near its supportive zones with several oscillators like CCI suggesting stretched downside conditions which could pave way for short-lived rebounds if prices stabilize above65K–66K area pushing through nearby resistances around67K–70K thus shifting structures towards recovery especially given weakened trend strengths noted by ADX readings。
Bearish Perspective:
This cryptocurrency continues trading beneath all key EMAs & SMAs reinforcing firmly negative backdrop despite recent consolidations.MACD remains negative whilst failing attempts reclaiming critical resistances favor ongoing pressures skewed towards breakdowns beneath65k extending further into lower supports zones。
Frequently Asked Questions 🔎
What was bitcoin’s price on March twenty ninth two thousand twenty six ?
Bitcoin traded priced sixty-six thousand seven hundred fifty-nine dollars ninety-three cents($66,759。93),within range spanning sixty-six thousand two hundred sixty-six dollars four cents($66、266。04)to seventy-thousand one hundred eighty-five dollars seventy-five cents ($71、185。75)。
Is bitcoin experiencing uptrend or downtrend currently ?
Currently it exists under broader downtrends consistently falling below all major moving averages 。
What do technical indicators reveal regarding bitcoins state?
Indicators reflect mixed signals showcasing weak momentum alongside limited trending strengths despite signs indicating oversold scenarios 。
Which are essential price points worth monitoring?
Support hovers close around sixty-five thousand dollars($65 、00),with resistive clusters observed between sixty-seven thousand five hundred ($67500)& seventy-thousand ($70000).