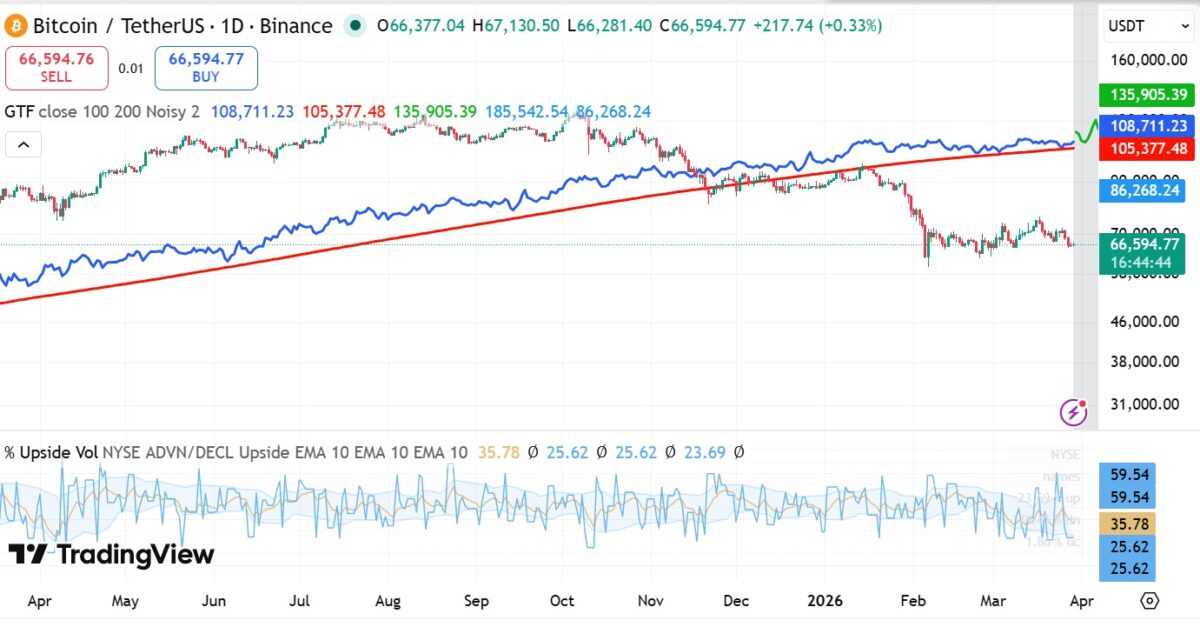
Since January 2026, Bitcoin has been trading beneath the support level indicated by Grand Trend’s Forecasting. Following this trend breakdown, $BTC has faced considerable bearish pressure, dropping below both its long-term and short-term realized prices.
In light of this prolonged weakness in the market structure, cryptocurrency analysts have voiced increased skepticism and forecast a continued decline based on realized price metrics.
Bitcoin Shows Signs of Weakness
As per Darkfost’s analysis, $BTC has remained under the adjusted realized price—excluding inactive supply—for two consecutive months.
The analyst pointed out that after adjustments, the realized price is around $72,500. This level now serves as immediate resistance for Bitcoin.
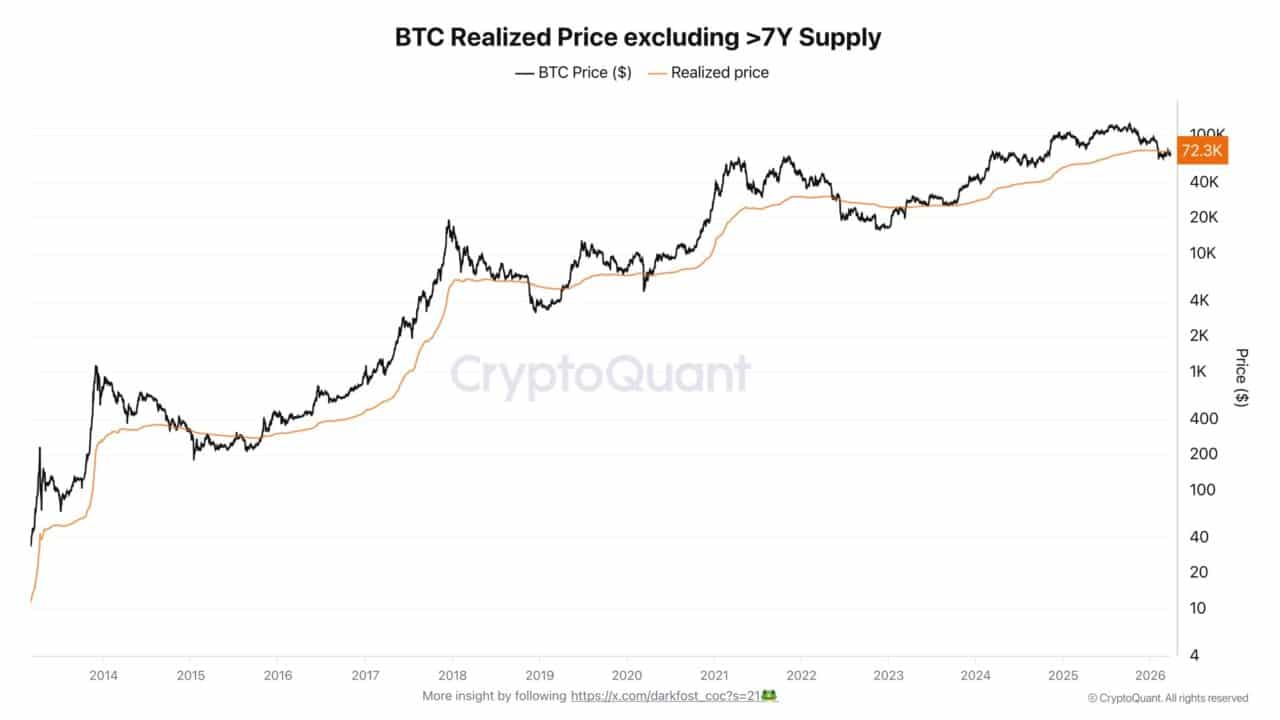
A look back at previous bear cycles reveals that Bitcoin typically stayed below this cost basis for a period ranging from six to ten months. If historical trends repeat themselves, $BTC may endure several challenging months before it can reclaim and surpass $72,500.
Naturally, when market prices linger beneath realized prices, it indicates that most buyers are operating at a loss. An increase in holders facing losses often raises selling risks; if these losses materialize further into reality, they could lead to even greater declines.
This situation is corroborated by data from Checkonchain indicating that the Short-Term Realized Price currently stands at $82.3k. This suggests recent purchasers are experiencing substantial losses which heightens their risk of capitulation.
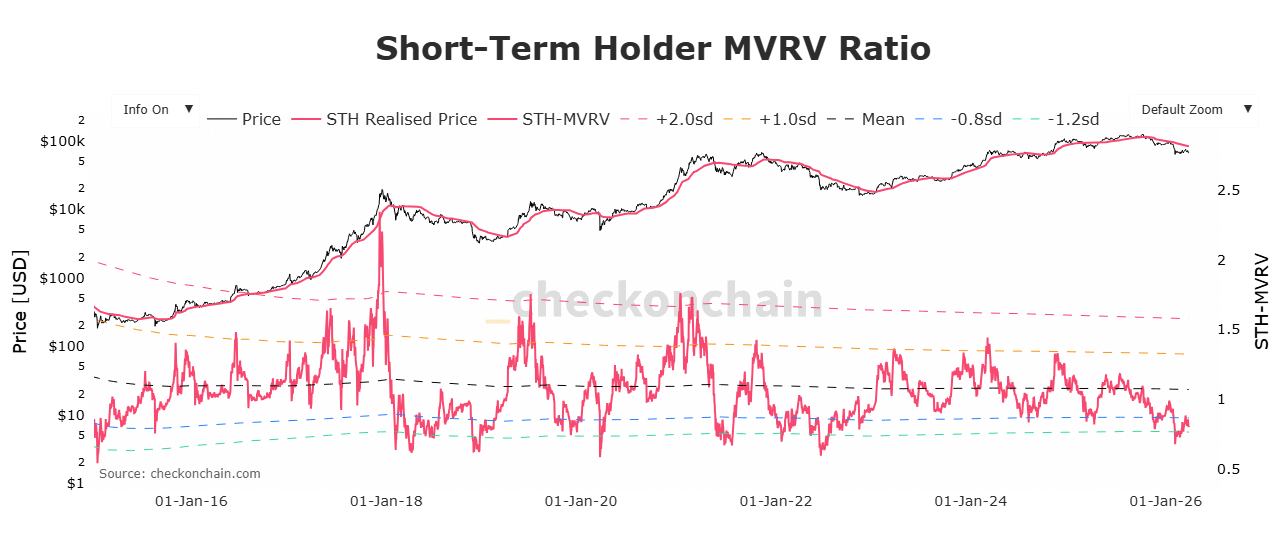
The realization of losses among short-term holders has stabilized above $300 million daily on average with about 5k $BTC sold at a loss each day. On March 29th alone, this cohort reported a staggering loss of $372 million—an indication of ongoing bearish sentiment in the market.
This trend historically leads to further weakening within the market environment resulting in extended periods of declining prices.
Caution Ahead for $BTC
The last five months have seen Bitcoin entrenched within a bearish framework while remaining below its realized price for two months—a clear sign of significant downward pressure affecting its value.
This scenario has caused ADV versus DECL metrics to fall below 50%, now resting at 35.78—indicating an influx into declining asset territory where sellers dominate proceedings and any attempts at recovery fail due to insufficient support levels being present in the market landscape.
Additionally,
the EMA line remains between 25-35 levels suggesting persistent weakness while reinforcing evidence supporting ongoing negative trends impacting pricing structures across various charts associated with$ BTC . These conditions expose$ BTC to potential additional declines ahead.
If current pricing persists alongside STH sales continuing unabated,
$ BTC could drop towards approximately$62K.
However ,realized values recorded on Binance hover near$60 ,490 providing some degreeof support against drastic falls .
So long as$ BTC maintains above these thresholds ,it will avert further downturns allowing spacefor possible rebounds .
Nevertheless ,before any notable recoveries can occur,$72K must first be reclaimed followed closelyby targetingthe STHrealizedprice setataround$82Kto achieve substantial gains moving forward .
A Brief Conclusion:
$Bitcoin continues holding steadybelow$72 ,500—theadjustedprice excludinginactive supply—for overtwo fullmonths now.
$BTC needs topersistabove60,$490to preventanyadditionalslipsandmustreclaimitspositionatapproximately$$72,Kif it hopesforanysignificantupwardmovementinvaluations goingforward!