On Tuesday, Bitcoin is poised to mark its sixth consecutive month of losses, a streak that ties the longest in its history and has only been seen once before in 2018. Following that period, $BTC experienced a remarkable rally of 300%.
Bitcoin Monthly Performance: Insights from Historical Trends
Bitcoin has recorded five consecutive months of negative closes.
The months include October, November, December, January, and February.
The close for March will be finalized on Tuesday.
Currently,$BTC stands at $66k and is down for the month.
If March closes red as well, it would equal the longest losing streak in Bitcoin’s history.
This record was established… pic.twitter.com/0gU0erkEI6
— Jeremy (@Jeremybtc) March 27, 2026
A look at the monthly returns highlights this ongoing trend: January saw a decline of 10.17%, February dropped by 14.94%, and so far in March there’s been a decrease of 1.69%. This follows three previous months (October through December) that also closed negatively last year; these are clearly marked on the chart. The only similar situation occurred between late 2018 into early 2019 when $BTC hit bottom before embarking on one of its most significant recoveries.
The historical averages indicate April typically sees an increase of around 13.06%, while May averages an uptick of about 8.18%. Notably, there has never been a case where six consecutive negative monthly closes were followed by another loss within Bitcoin’s documented history. While this does not guarantee recovery will happen immediately, it does alter how we view current market conditions; prolonged selling often flushes out weaker investors leading to less overhead pressure moving forward.
Bitcoin Daily Chart Analysis: Rising Channel Maintains Position At Supertrend Level
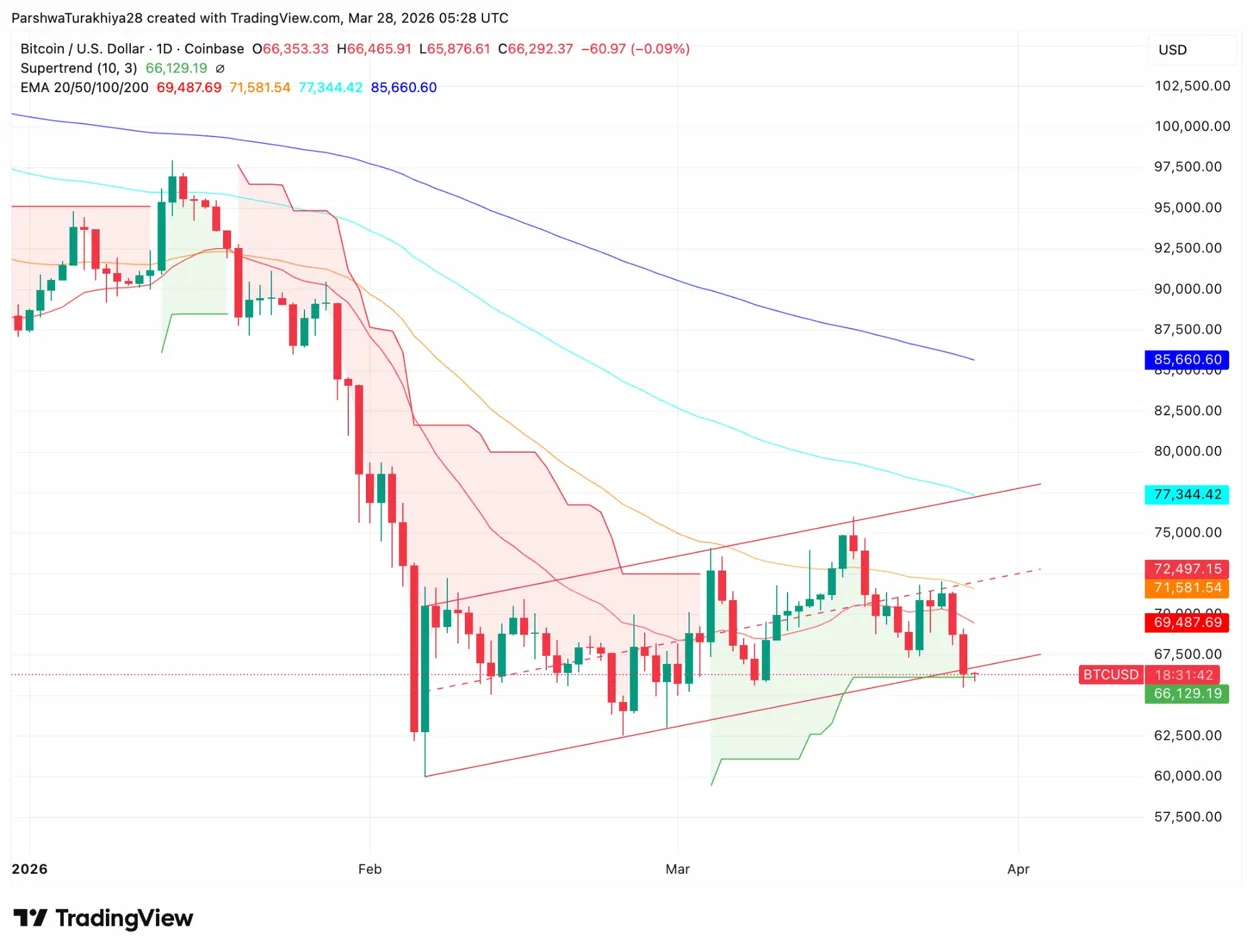
An examination of the daily chart reveals that $BTC has formed an upward channel since hitting lows near $60K back in February. The lower boundary aligns closely with both the Supertrend indicator at $66,129 and current price levels—this confluence serves as critical support with Friday’s closing price just above it at $66,292.
The four exponential moving averages (EMAs) are all positioned bearishly above current prices; specifically—the short-term EMA sits at $69K+, while longer-term EMAs range from approximately $71K to over $85K—all showing declines currently underway which indicates resistance levels ahead must be overcome for any bullish reversal attempt to gain traction again soon enough!