
Investors observing the fluctuating price of bitcoin, currently at $BTC$69,649.34, may be misinterpreting its recent turbulent behavior through a pessimistic perspective.
Since reaching near $60,000 on February 6th, bitcoin has predominantly oscillated between $65,000 and $75,000. This period is characterized more by fatigue than by any clear directional trend.
This scenario illustrates a situation where investors face challenges not only from sudden declines but also from time itself; prolonged periods of sideways movement wear down both bullish and bearish traders due to frequent false breakouts.
A Misinterpretation of Market Signals
Some social media users are labeling this as a bear flag—a technical indicator suggesting a minor recovery within an overarching downward trend. Typically, bear flags can reignite bearish momentum and often lead to further sell-offs.
This has led to concerns that such a pattern could exacerbate the downtrend for bitcoin that initiated in early October after it reached unprecedented highs exceeding $126,000.
However, this interpretation might be flawed because traditional technical analysis indicates that bear flags are usually brief pauses lasting just a few days before they resolve into deeper declines.
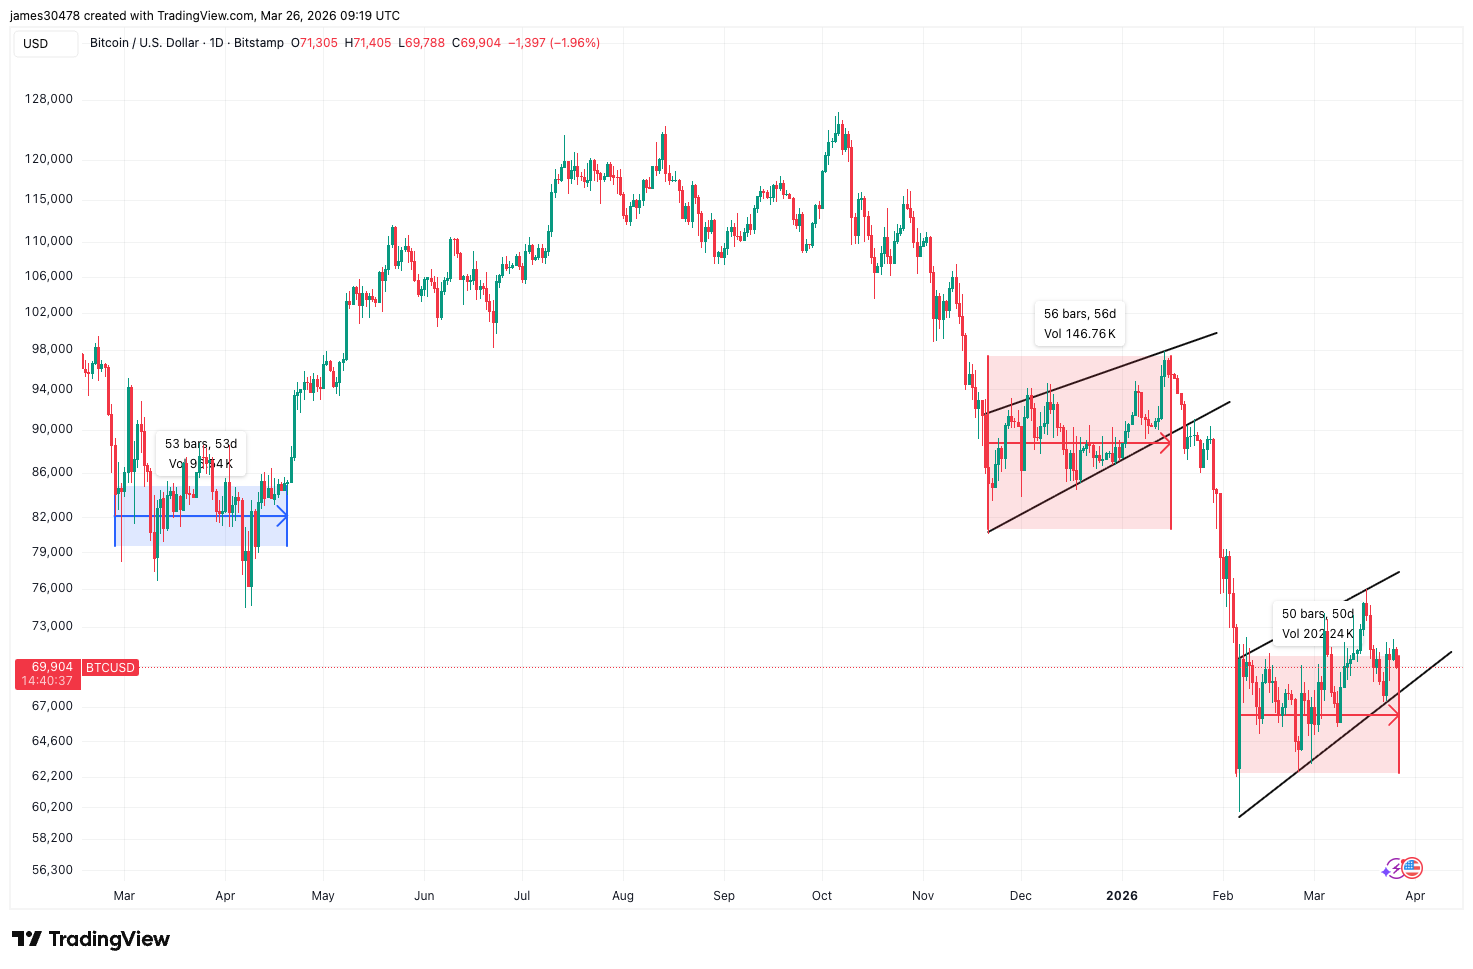
The current consolidation phase has persisted for nearly 50 days—significantly longer than what would typically characterize a bear flag. This extended duration implies that bears may no longer dominate the market; instead, it appears balanced with neither bulls nor bears willing to push prices significantly higher or lower. This represents classic indecision in market dynamics.
This does not completely eliminate the possibility of another significant drop—as witnessed following the December-January consolidation—but it recontextualizes recent market movements as indecisive rather than fundamentally bearish in nature.
The Distinction Between 2026 and 2022
The ongoing cycle for bitcoin presents notable differences compared to its trajectory in 2022. Bitcoin experienced an explosive rise from $10,000 to $60,000 between October 2020 and early 2021 with minimal support established along this ascent. Consequently when the market corrected in 2022 it retraced much of this gain leading up to capitulation driven by FTX events which saw prices plummet to around $15,000 by November of that year.
In contrast during most of 2024 bitcoin has been consolidating within the range of $50,000-$70,000 effectively creating foundational support at these levels where trading is currently occurring.
Research from CoinDesk indicates robust demand within this price bracket with over 600k $BTC accumulated throughout this drawdown phase suggesting there’s now stronger structural integrity compared to previous cycles.