Bitcoin’s recent period of fluctuating prices around the $70,000 mark is interpreted by some traders as a sign that the cryptocurrency may be stabilizing. However, technical analysis suggests that the pattern currently emerging on the daily chart could indicate not a recovery phase but rather a distribution pattern preceding another decline, reminiscent of previous downturns observed since late 2025.
The Consistency of Bitcoin’s Distribution Patterns
A crypto analyst known as Ardi on social media platform X has pointed out that Bitcoin’s distribution phases appear to remain consistent because its underlying mechanism does not change. This observation pertains to Bitcoin’s current trading range between $63,000 and $72,000 since early February.
The premise behind this technical analysis is that during bearish trends, Bitcoin tends to exhibit a predictable behavior. The price enters into a range where traders start perceiving consolidation as stability; liquidity accumulates above local highs; and then there’s often a brief breakout beyond this range which attracts optimism from many crypto investors.
Nevertheless, such optimism can be fleeting. When the price fails to maintain levels above these highs in the range, it signals structural weakness leading to subsequent declines towards support levels within that range.
The accompanying chart illustrates two nearly identical sections. The first distribution phase occurred between approximately mid-$80,000 and low-$90,000 from November 2025 through January 2026.
This movement culminated with Bitcoin reaching around $96,000 before failing to sustain itself above this level and subsequently declining towards lower ranges. This drop eventually breached critical support levels taking prices down to about $63,000 in early February.
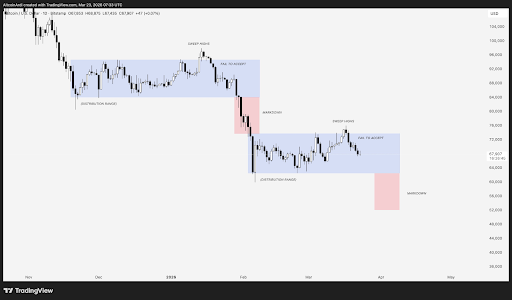
Bitcoin Price Chart Source: @ArdiNSC On X
The Possibility of Falling Below $50,000
An attempt at surpassing local highs over $76,000 in early March sparked discussions regarding potential recovery for Bitcoin prices. However, ultimately this effort failed as prices rolled back down again. Recent price movements have predominantly shown bearish candlesticks pushing Bitcoin closer toward lower boundaries within its current trading range once more.
A particularly concerning aspect visible on the chart is an anticipated zone following this current trading period. If we project prior markdowns from late January onto present price actions it indicates potential for breaking below last month’s low at around $63K.
This projection notably suggests outcomes extending downward towards values near or even below $50K—potentially dipping as low as approximately $48K—aligning with forecasts from various analysts who anticipate that Bitcoin might indeed fall beneath the crucial threshold of $50K before establishing new lows ahead.
Featured image sourced from Dall.E; chart provided by TradingView.com