The price of Bitcoin ($BTC) has continued to trade within a bear flag pattern, as ongoing conflicts in the Middle East weigh heavily on market sentiment.
Bitcoin’s on-chain metrics indicate a cautious stance among investors, reflecting hesitation rather than clear directional confidence.
Immediate resistance levels for Bitcoin buyers are positioned at $76,500 and $84,400.
On Tuesday, Bitcoin experienced a minor decline of 0.51%, barely maintaining its position above the $70,000 threshold. The daily candlestick chart reveals a neutral formation that underscores prevailing uncertainty amid geopolitical tensions. Recent on-chain data highlights widespread fear and doubt among both retail and institutional investors, signaling an absence of strong momentum propelling the $BTC price forward.
Risk Aversion Dominates as Large Bitcoin Transactions Decline
On March 24th, the cryptocurrency market saw a slight dip of 0.3%, reducing its total capitalization to approximately $2.42 trillion. This downturn was followed by renewed geopolitical strains after Iran officially denied engaging in ceasefire negotiations with U.S. officials.
Despite this denial, both sides have published detailed demands outlining their conditions for any potential ceasefire agreement. As tensions involving the U.S., Iran, and Israel persist—further fueling uncertainty—the latest on-chain activity related to Bitcoin users reflects risk-averse behavior rather than decisive moves in either direction.
Notably, major holders of Bitcoin have significantly curtailed large transactions; activity levels have dropped to lows unseen in recent years amid ongoing regulatory concerns and global instability.
Santiment’s data shows that daily transactions exceeding $100,000 averaged just 6,417 last week—the lowest since September 2023—while transfers over $1 million fell even further to an average of 1,485 per day—the slowest pace recorded since October 2024.
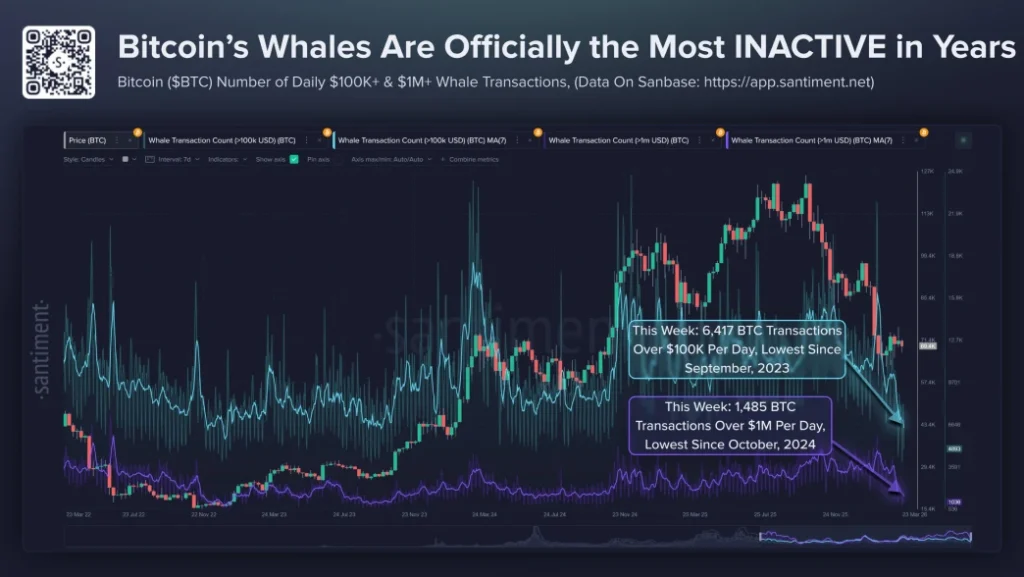
The charts tracking whale movements reveal sharp declines across mid-sized and ultra-large transfers simultaneously. Large holders appear cautious like smaller investors—they are largely holding onto their coins while awaiting clarity regarding stalled legislation such as the Digital Asset Market Clarity Act currently under consideration by Congress amidst broader international uncertainties.
Bitcoin itself has exhibited moderate volatility around the $70K level during recent trading sessions. The subdued activity from whales offers no definitive clues about future price direction; it simply indicates that significant capital remains parked temporarily until clearer signals emerge.
$BTC Faces Potential Downside Risk Near Bear Flag Pattern
Over the past seven weeks, Bitcoin’s price has gradually recovered within two ascending trendlines visible on daily charts—a series marked by higher highs and higher lows suggesting tentative strength—but technical analysis points toward forming a bear flag pattern instead.
This setup typically follows strong downward trends succeeded by short-lived recoveries contained within channel boundaries aiming to offset bearish pressure temporarily. Should selling intensify again soon,the BTC price could drop more than 4.8% toward support near $67, 300 —the lower boundary of this flag formation’s trendline support zone.
A break below this level might signal continuation of prevailing downtrend momentum pushing prices further down toward roughly $56, 000.
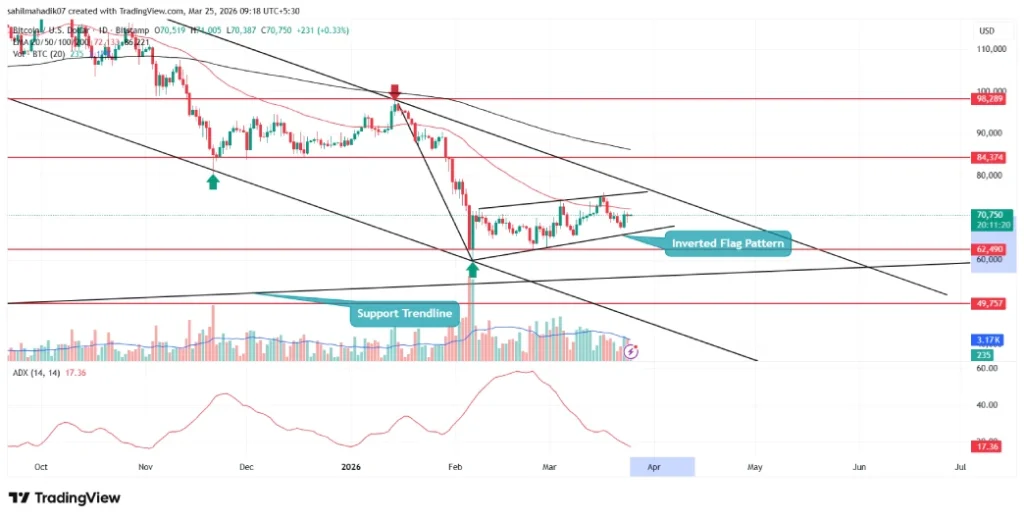
$BTC / USDT – Daily Chart
< span> ;Conversely , if bitcoin manages &amp;amp;amp;amp;amp;aacute ;to surpass resistance at & ;#36 ;75 ,500 , bulls may target initial gains near & ;#36 ;84 ,400 followed subsequently by upward movement towards & ;#36 ;98 ,200 .