While Bitcoin’s price movements may appear ambiguous at first glance, a crypto analyst suggests that the true narrative is unfolding beyond the typical charts traders are observing. Crypto analyst Crypto Tice asserts that amidst all the noise surrounding Bitcoin’s pricing, there exists a singular, consistently reliable indicator that has historically mapped out every significant Bitcoin cycle: the Purchasing Managers’ Index (PMI). In a recent post on X, Tice emphasized that the PMI cycle is crucial and currently signaling important trends.
The PMI Cycle’s Role in Identifying Bitcoin Lows
The PMI serves as a monthly economic gauge reflecting business activity within both manufacturing and service sectors. Although this might seem unrelated to cryptocurrency markets at first glance, Tice’s analysis hinges on historical patterns: Bitcoin typically reaches its most critical lows during periods of PMI contraction rather than when market sentiment is optimistic.
During these contraction phases, liquidity tends to build up quietly behind the scenes. The crypto market may seem fragile; negative sentiment prevails while price movements stagnate or decline. However, this phase often marks an essential period for long-term accumulation of Bitcoin.
As illustrated in the accompanying chart, each significant Bitcoin cycle reveals green zones emerging during times of PMI contraction followed by robust upward movements once conditions shift. These patterns are derived from previous market bottoms with notable examples being accumulation ranges prior to rallies in 2017 and 2021.
The green-shaded areas labeled “scale out” periods consistently align with peak price stages across various cycles observed in 2013, 2017, and 2021. Conversely, red-shaded “scale in” zones highlight points where accumulation occurs.
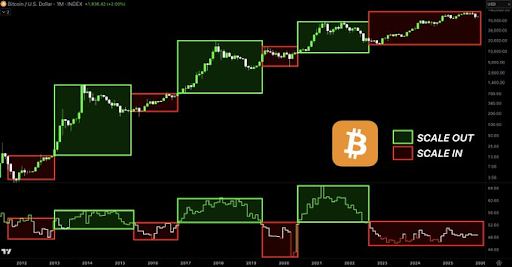
Bitcoin Price Chart Source: @CryptoTice_ On X
Current Insights from the PMI Indicator
As of now, the Purchasing Managers’ Index stands just above 48—hovering close to the expansion threshold reading of 50. This indicates that Bitcoin finds itself at an early stage within this index structure—a zone historically preceding major rallies as depicted in earlier charts.
The current indicator positions itself within a red accumulation zone and is anticipated to trend upwards over upcoming months. According to Tice’s analysis, we are presently situated within an identical zone marking every major buying opportunity throughout history; however this particular accumulation phase may not last much longer.
Currently priced at $71,070 after experiencing a rise of 3.8% over the past day,Bitcoin has remained around $70K for some time now—supporting theories suggesting it has already reached its bottom point. Interestingly enough,some analysts have begun pointing towards this possibility; nevertheless,Bitcoin continues grappling with investor fear sentiment which recently resurfaced just days after signs of recovery were noted.
Featured image created using Dall.E; chart sourced from Tradingview.com