
The Bitcoin Rainbow Chart forecasts a wide array of potential price points for the cryptocurrency as it approaches April 1, 2026.
This model indicates that Bitcoin’s ($BTC) price levels on that date could range from significantly undervalued to extremely optimistic market conditions.
The lowest tier, referred to as ‘Basically a Fire Sale,’ suggests that $BTC might be valued at around $56,182.96, indicating historically low prices. Following this is the ‘BUY!’ zone at approximately $75,695.68 and then the ‘Accumulate’ range near $97,674.95—where long-term investors typically start increasing their holdings.
As we move up the scale, the ‘Still cheap’ band is estimated at about $126,074.98 while the ‘HODL!’ area appears close to $164,973.96; this suggests a period where holding onto assets rather than aggressive purchasing has been more favorable historically.
As prices rise further still, cautionary signals emerge with levels like ‘Is this a bubble?’ around $209,993.49 and ‘FOMO intensifies’ at roughly $268,883.67—indicating increased speculative behavior in the market.
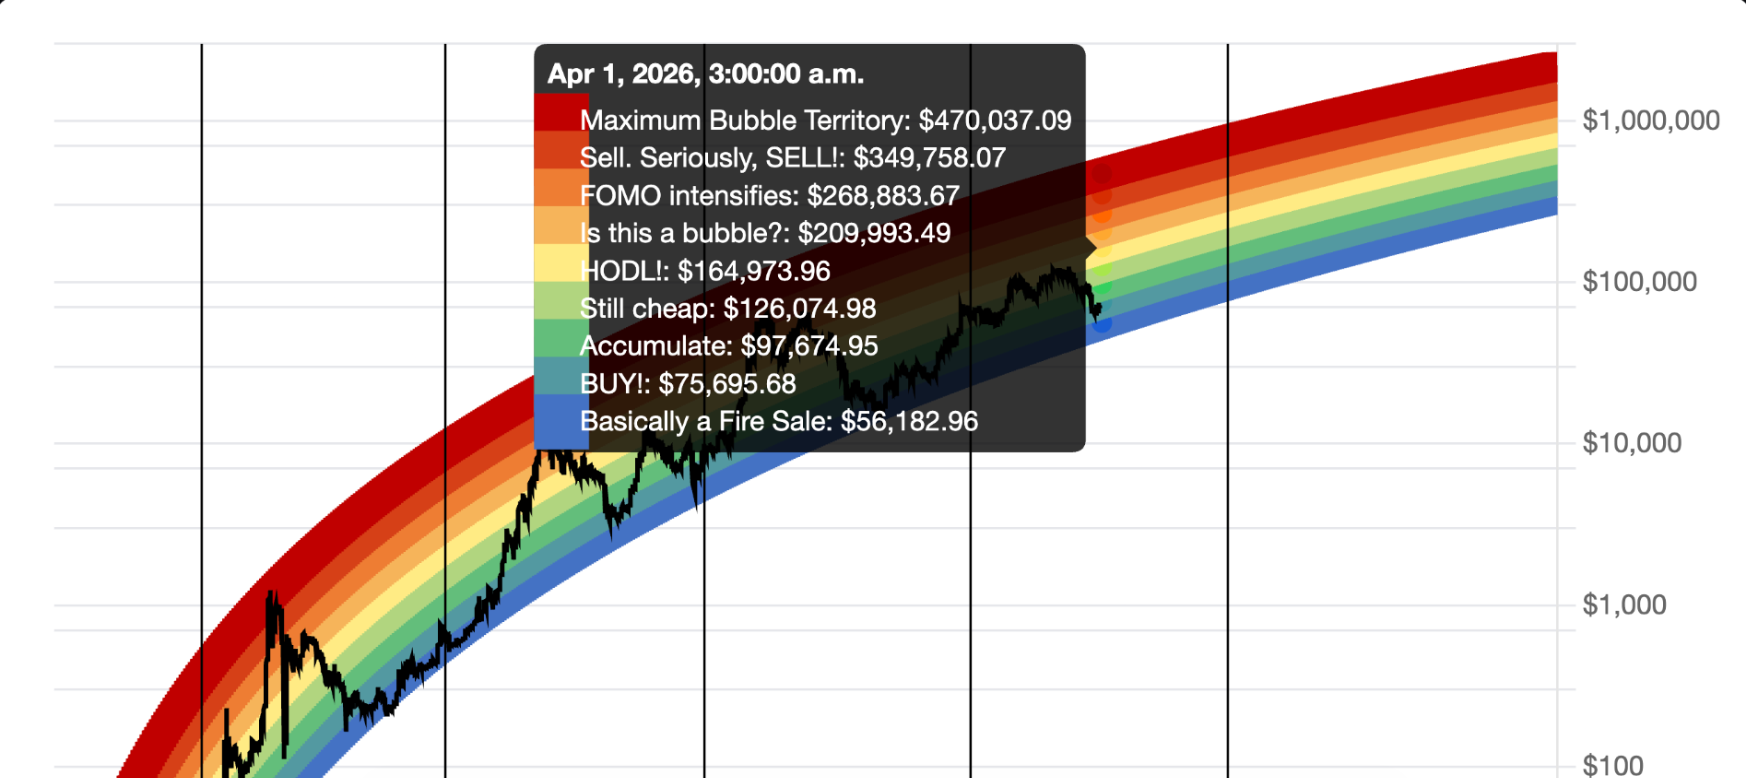
At its peak predictions on this chart show a warning sign for selling at approximately $349,758.07 labeled as ‘Sell. Seriously SELL!’ while ‘Maximum Bubble Territory’ reaches about $470,037.09—signifying an overheated market where previous cycles have peaked out.
Potential Future Price of Bitcoin
The Bitcoin Rainbow Chart employs a logarithmic growth curve to categorize Bitcoin into color-coded bands which illustrate how much its price strays from long-term trends—highlighting possible overvaluation or undervaluation scenarios.
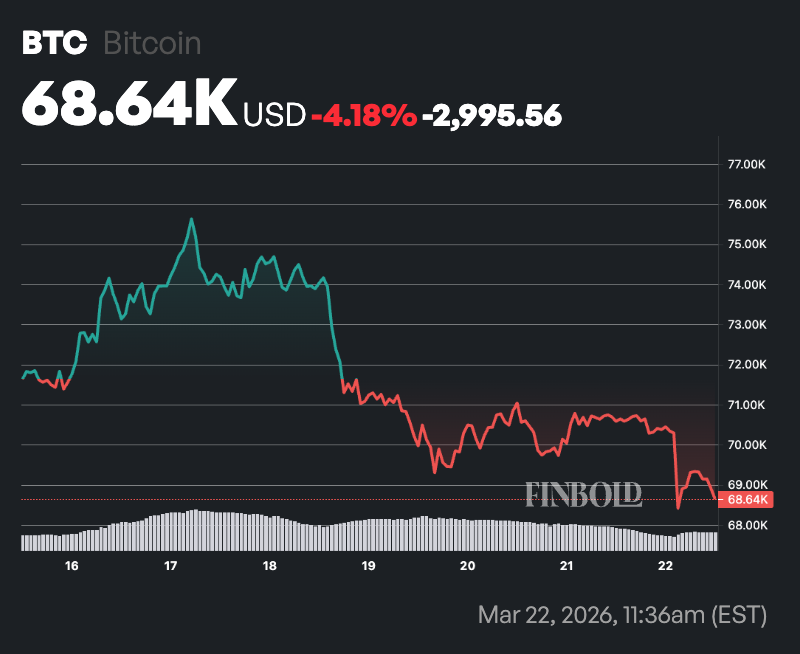
Currently trading around $68,600 as of March 22nd places Bitcoin between the zones labeled ‘Basically a Fire Sale’ and ‘BUY!’ according to projected ranges for early April 2026 based on this model’s analysis.
If future price movements align with historical patterns outlined in this chart framework it implies that we are still in an early stage of what could be considered a larger cycle rather than nearing peak phases.
This context leads us to reasonably anticipate that by April 1st ,2026 ,Bitcoin may find itself within lower accumulation brackets potentially ranging between approximately$75 ,000 and$100 ,000 if upward momentum persists .
Nonetheless,the model accommodates significant fluctuations meaning $BTC could either hover near current values or surge into higher tiers influenced by macroeconomic factors,demand shifts,and overall sentiment across cryptocurrency markets .
Featured image via Shutterstock