Bitcoin is currently exhibiting conflicting indicators, as on-chain flow data hints at a potential new bullish phase, while the price chart reveals a recent drop below short-term support levels. This combination places Bitcoin at a critical juncture, with one side showing signs of increased liquidity and the other indicating growing technical vulnerabilities.
Renewed Bullish Signals for Bitcoin as Inter Exchange Flow Pulse Rises
Recent observations suggest that Bitcoin may be displaying early signs of renewed vigor, particularly after the Inter Exchange Flow Pulse (IFP) began to rise again. This information comes from a chart shared by Ali Charts utilizing CryptoQuant data. The IFP measures the intensity of Bitcoin transactions between centralized exchanges and serves as an indicator for market liquidity shifts. The latest data indicates that after a prolonged decline, the IFP is beginning to trend upwards just as Bitcoin starts to recover from its recent downturn.
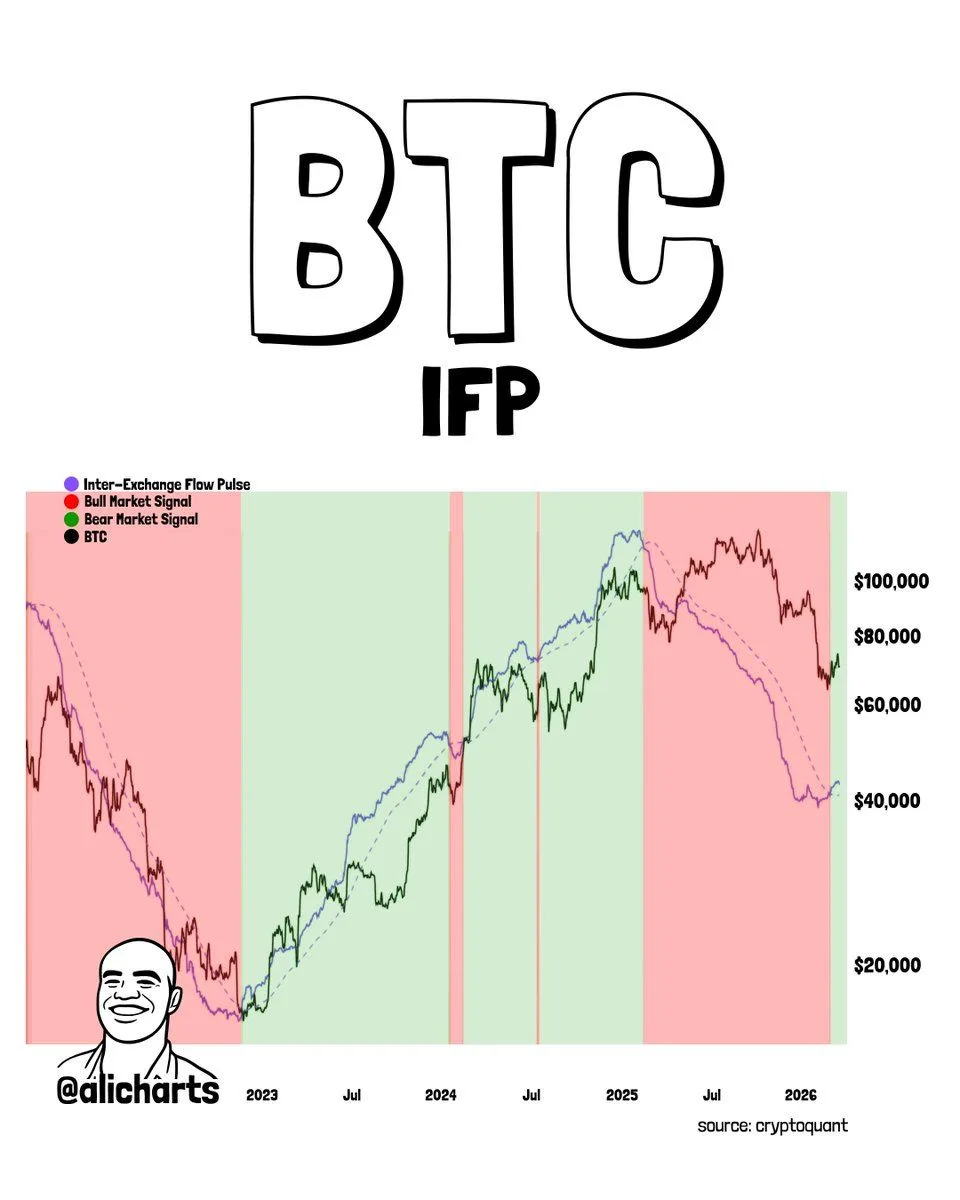
Source: Ali Charts
The chart juxtaposes both Bitcoin and IFP against various colored market phases; green zones signify bullish signals while red zones indicate bearish conditions. Historical patterns reveal that when the IFP increases and maintains strength, it often coincides with broader upward trends in Bitcoin’s price. Conversely, declining IFP values typically correlate with weaker market phases or significant peaks.
In this current scenario, although the IFP had been trending downward during much of the recent decline, it has started to show an upward trajectory towards the end of this analysis period. This shift is crucial because it suggests stronger liquidity movement between exchanges—a sign some analysts interpret as an indication that market activity might be picking up once more. Consequently, this development could signal fresh buying opportunities.
However, it’s important to note that previous cycles did not always follow a straightforward upward path post-signal; they included pullbacks and false starts before establishing clear trends. Thus far, it’s prudent to regard this latest turn in IFP more as an initial market signal rather than definitive evidence of an ongoing rally.
The timing here is also noteworthy; this new uptick in IFP follows months spent within a bearish marked phase on charts—an area associated with negative conditions for prices. Should this pulse continue its ascent alongside stronger price movements from Bitcoin itself, it could bolster arguments suggesting we are entering into another expansion phase within the market.
The current analysis implies that Bitcoin stands at an essential transition point where historical patterns have shown such indicators can lead to periods of heightened pricing activity. Whether or not we see sustained bullish momentum will likely hinge on whether both these metrics—the rising IFP and recovering prices—can maintain their positive trajectories moving forward.
Bitcoin Falls Below Triangle Support As Focus Shifts Back To $62K-$63K Range
A breakdown has occurred below local support around $69k for Bitcoin which has exited out of its symmetrical triangle formation according to analyst Cryptorphic’s insights shared via X platform charts. This move followed resistance encountered near $71k-$72k which had served briefly as short-term barriers against further advances in price action—indicating weakening momentum along with potential declines toward lower support levels ahead.
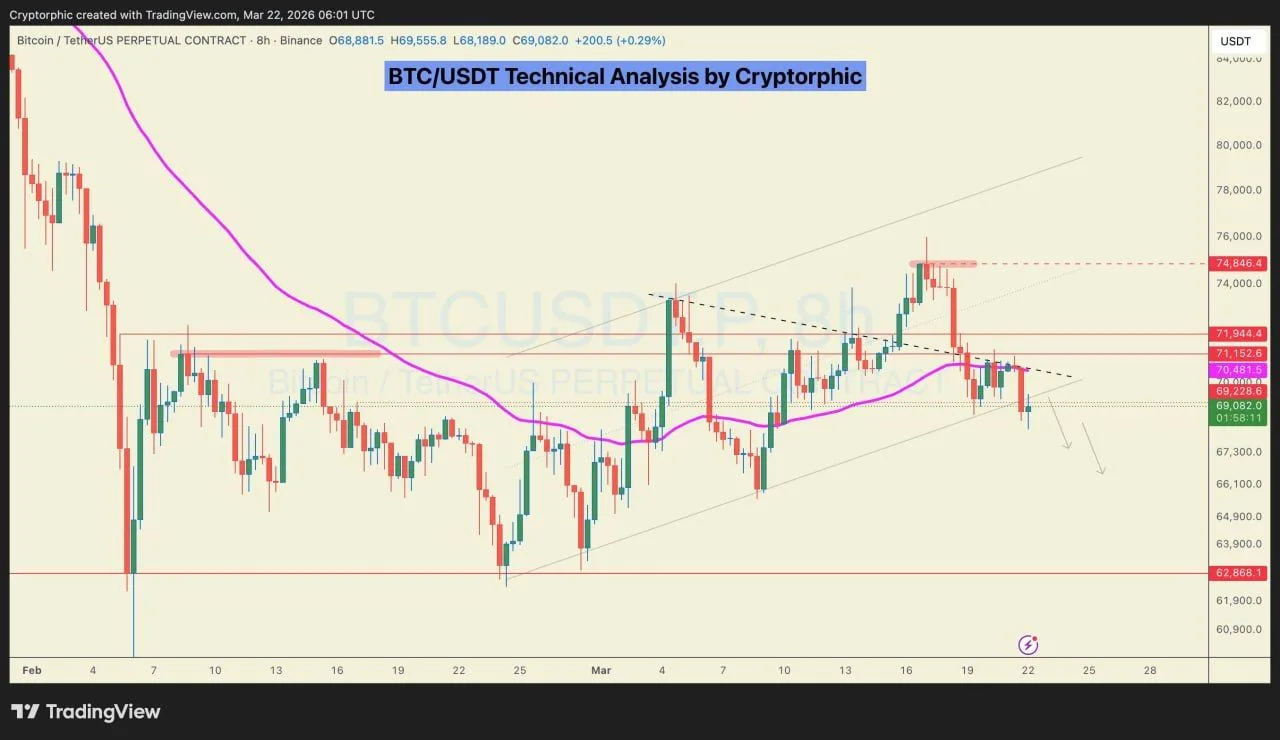
Source: Cryptorphic
An eight-hour BTC/USDT chart from Binance illustrates how prices have slipped beneath lower boundaries established by earlier consolidation efforts within triangles formed over several sessions priorly observed thereon before ultimately failing attempts made previously aimed higher but unable sustain above nearby resistances afterwards leading back down through structures now viewed negatively by analysts alike indicating shifts towards bearish sentiment overall instead presently ongoing right now too!
This particular graph positions bitcoin beneath critical horizontal thresholds once supportive during previous ranges experienced recently but upon giving way allows further downside projections based upon arrows drawn suggesting sellers may retain control following breakdowns occurring subsequently thereafter too!
The next significant area identified lies between $62k-$63k range—a broader region recognized historically providing substantial supports potentially emerging target if weaknesses persist moving forward henceforth! Therefore present indications suggest bitcoin diverging away past consolidations transitioning back towards lesser liquidities wherein buyers must engage promptly should they wish capitalize effectively going forth hereafter!
At present moment key signals revolve around loss structural integrity rather than outright completion larger trend reversals already witnessed thus far; having failed resistances then lost local supports leaving pressure building below triangle formations accordingly if breakouts hold strong case strengthens bearishly indeed marking aforementioned ranges most closely monitored ahead!