Bitcoin is currently in a phase of recovery, but the momentum has slowed as it encounters significant resistance within the low-to-mid $70,000 range. The market has made a notable rebound from February’s dip near $60,000; however, recent price movements indicate that buyers must demonstrate their ability to do more than simply bounce back. This situation no longer appears to be just a temporary relief rally; rather, it necessitates sustained follow-through.
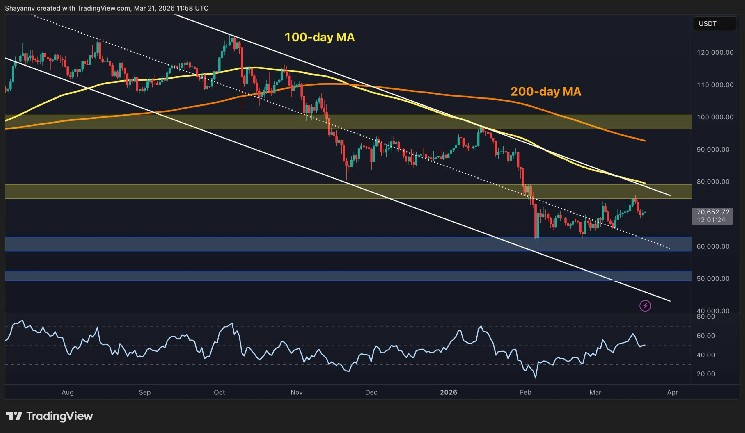
Bitcoin Price Overview: Daily Chart Insights
Examining the daily chart reveals that $BTC remains trapped within an overarching descending trendline and is positioned below both the 100-day and 200-day moving averages at approximately $80k and $92k respectively. Thus far, the larger trend hasn’t fully shifted in favor of buyers. Nevertheless, there has been a clear improvement from previous lows as prices have climbed back above local compression zones, preserving short-term recovery efforts.
The primary obstacle continues to be situated between $75k and $80k—this area serves as an initial significant supply zone overhead. A decisive reclaim of this region would bolster arguments for broader trend restoration while redirecting focus toward the next resistance cluster around $100k. Until such an event occurs, Bitcoin remains technically engaged in a wider corrective structure with critical support resting at around $60k for any substantial pullback.
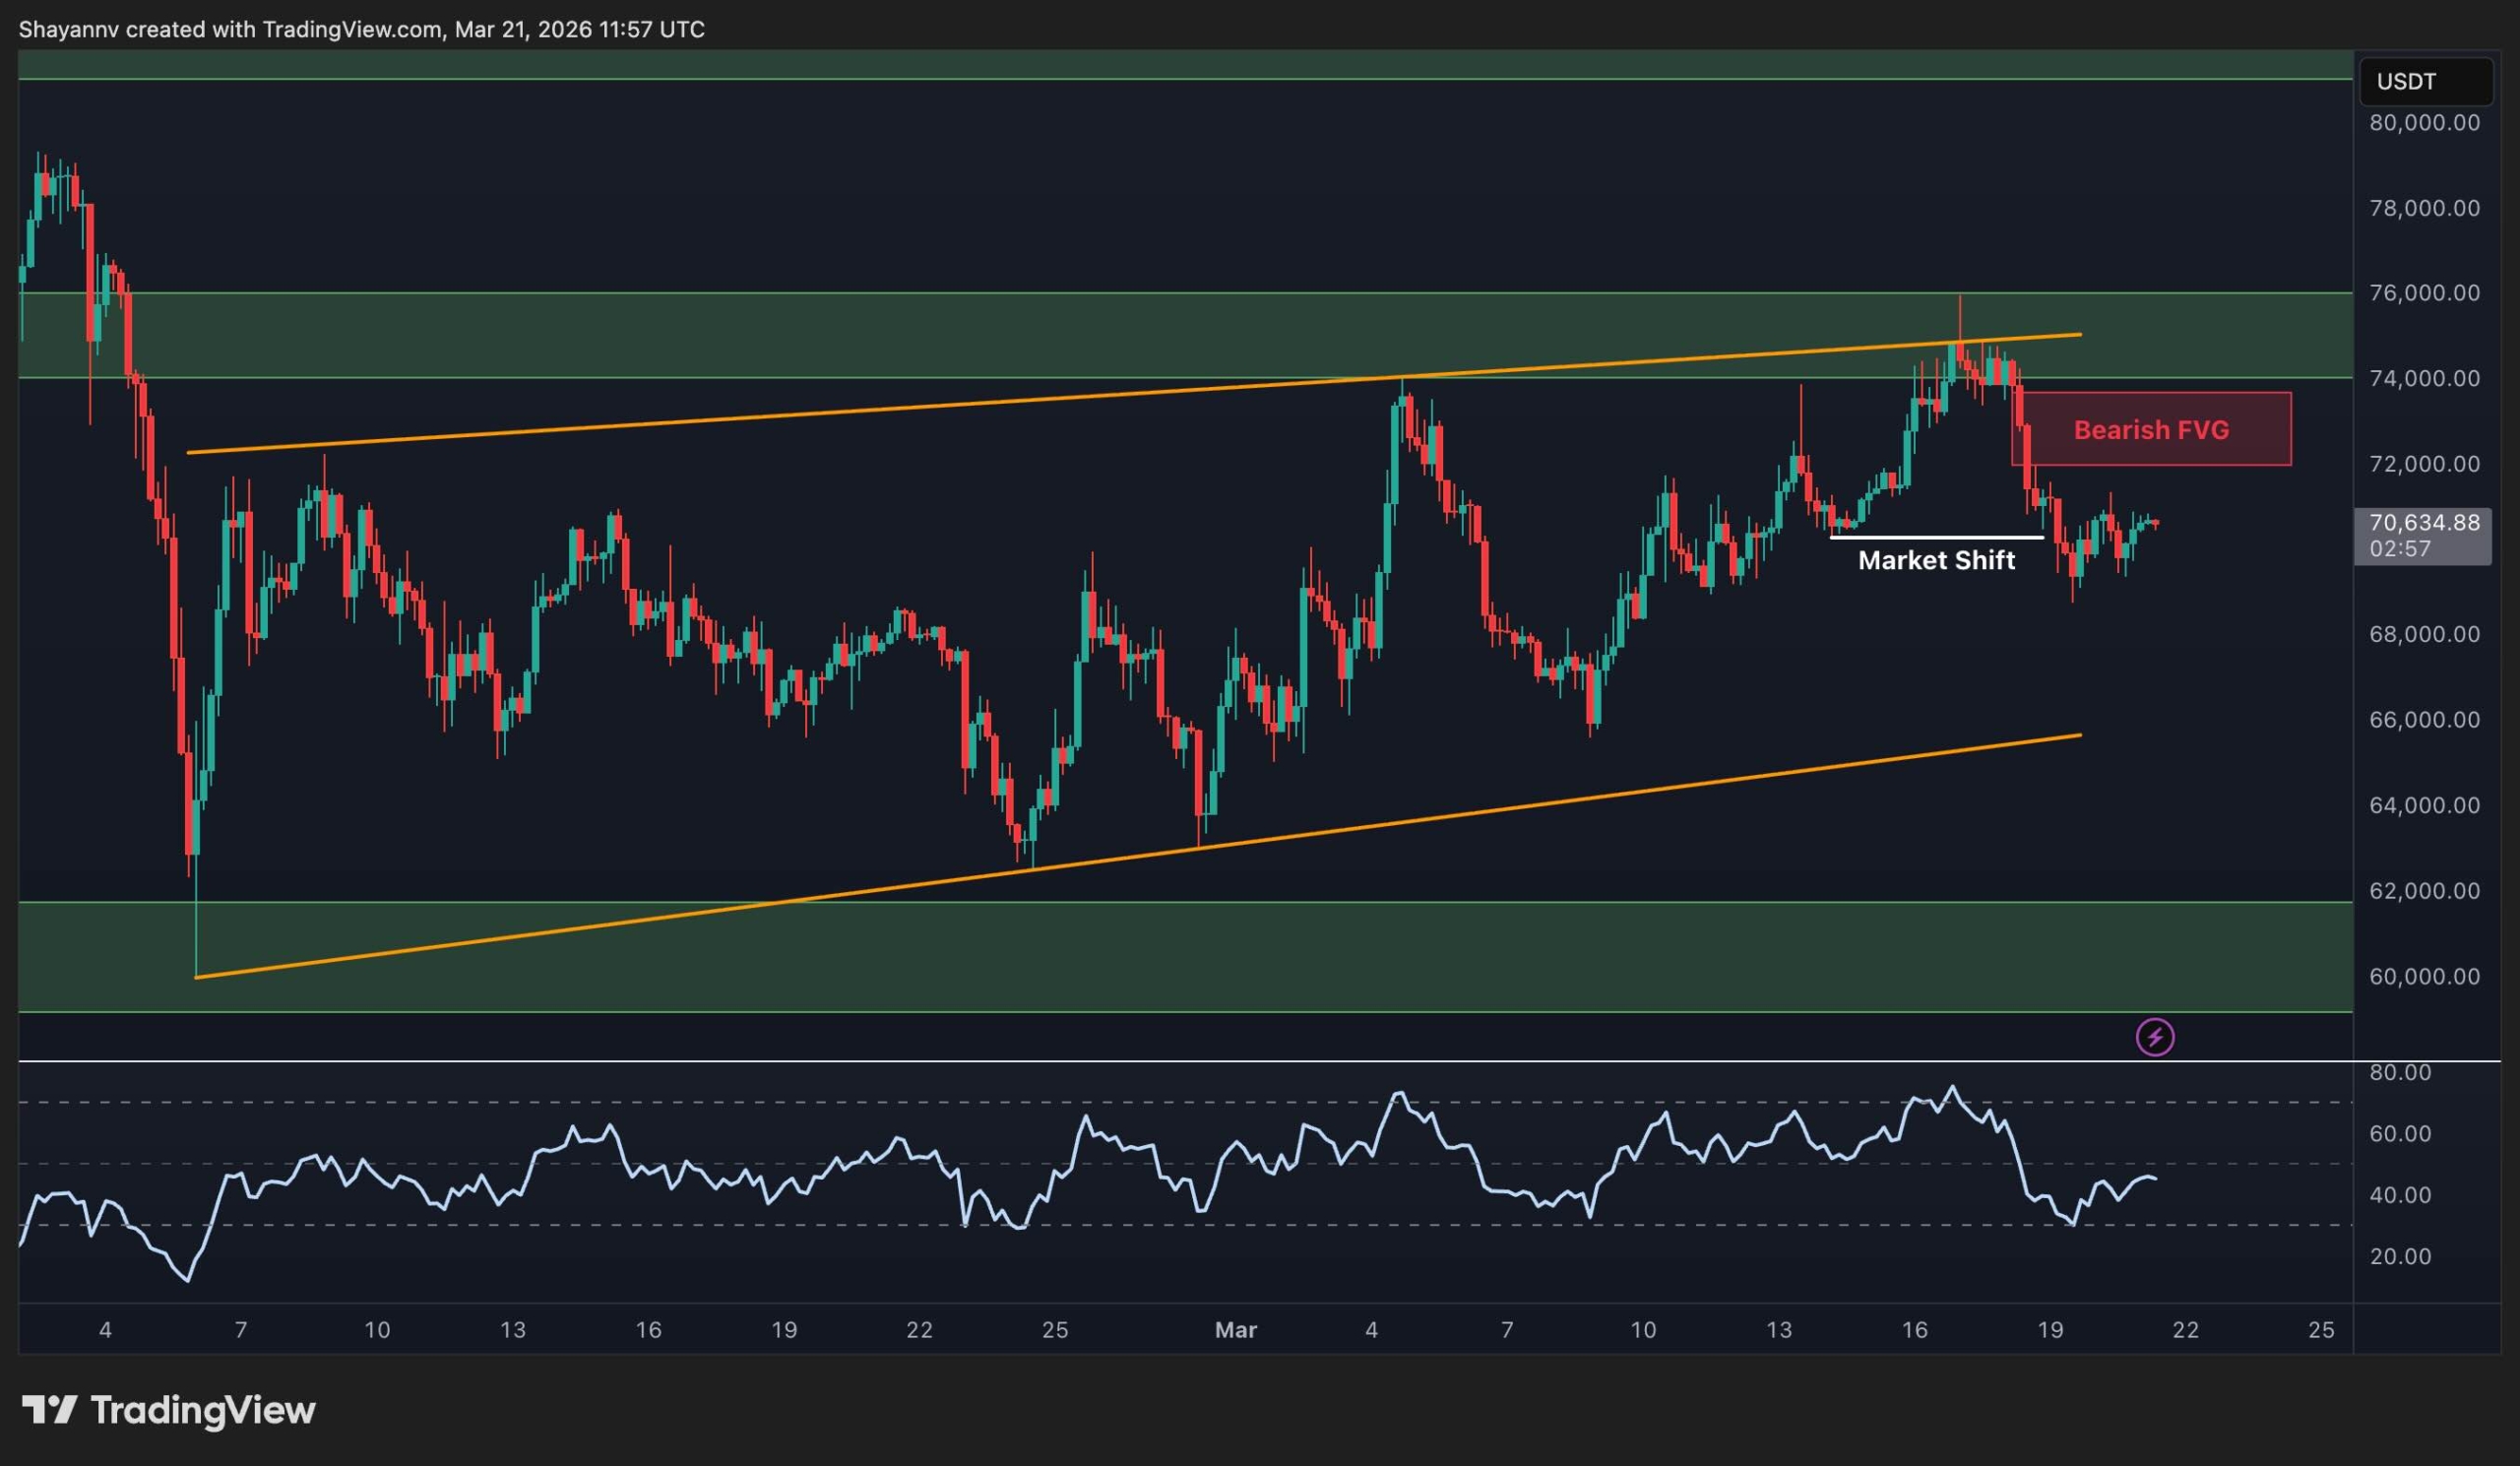
$BTC/USDT Four-Hour Chart Analysis
The four-hour chart provides insights into more immediate developments. Recently, Bitcoin ascended towards the upper section of its rising pattern but encountered overhead resistance where it was unable to maintain upward momentum before experiencing an abrupt decline. This sharp drop along with shifts in market structure have created a bearish fair value gap that could serve as immediate resistance for initiating further downward movement.
Despite this pullback not breaking overall recovery patterns yet—the price is stabilizing around the vicinity of $70k—as long as $BTC stays above its recent local base near $66k this can still be perceived as healthy consolidation rather than indicative of trend failure. In contrast though—short-term market dynamics may require either a definitive breakout above bearish FVG alongside overcoming the crucial threshold at $75k or undergoing deeper resets towards lower support levels before any significant upward movement can occur.
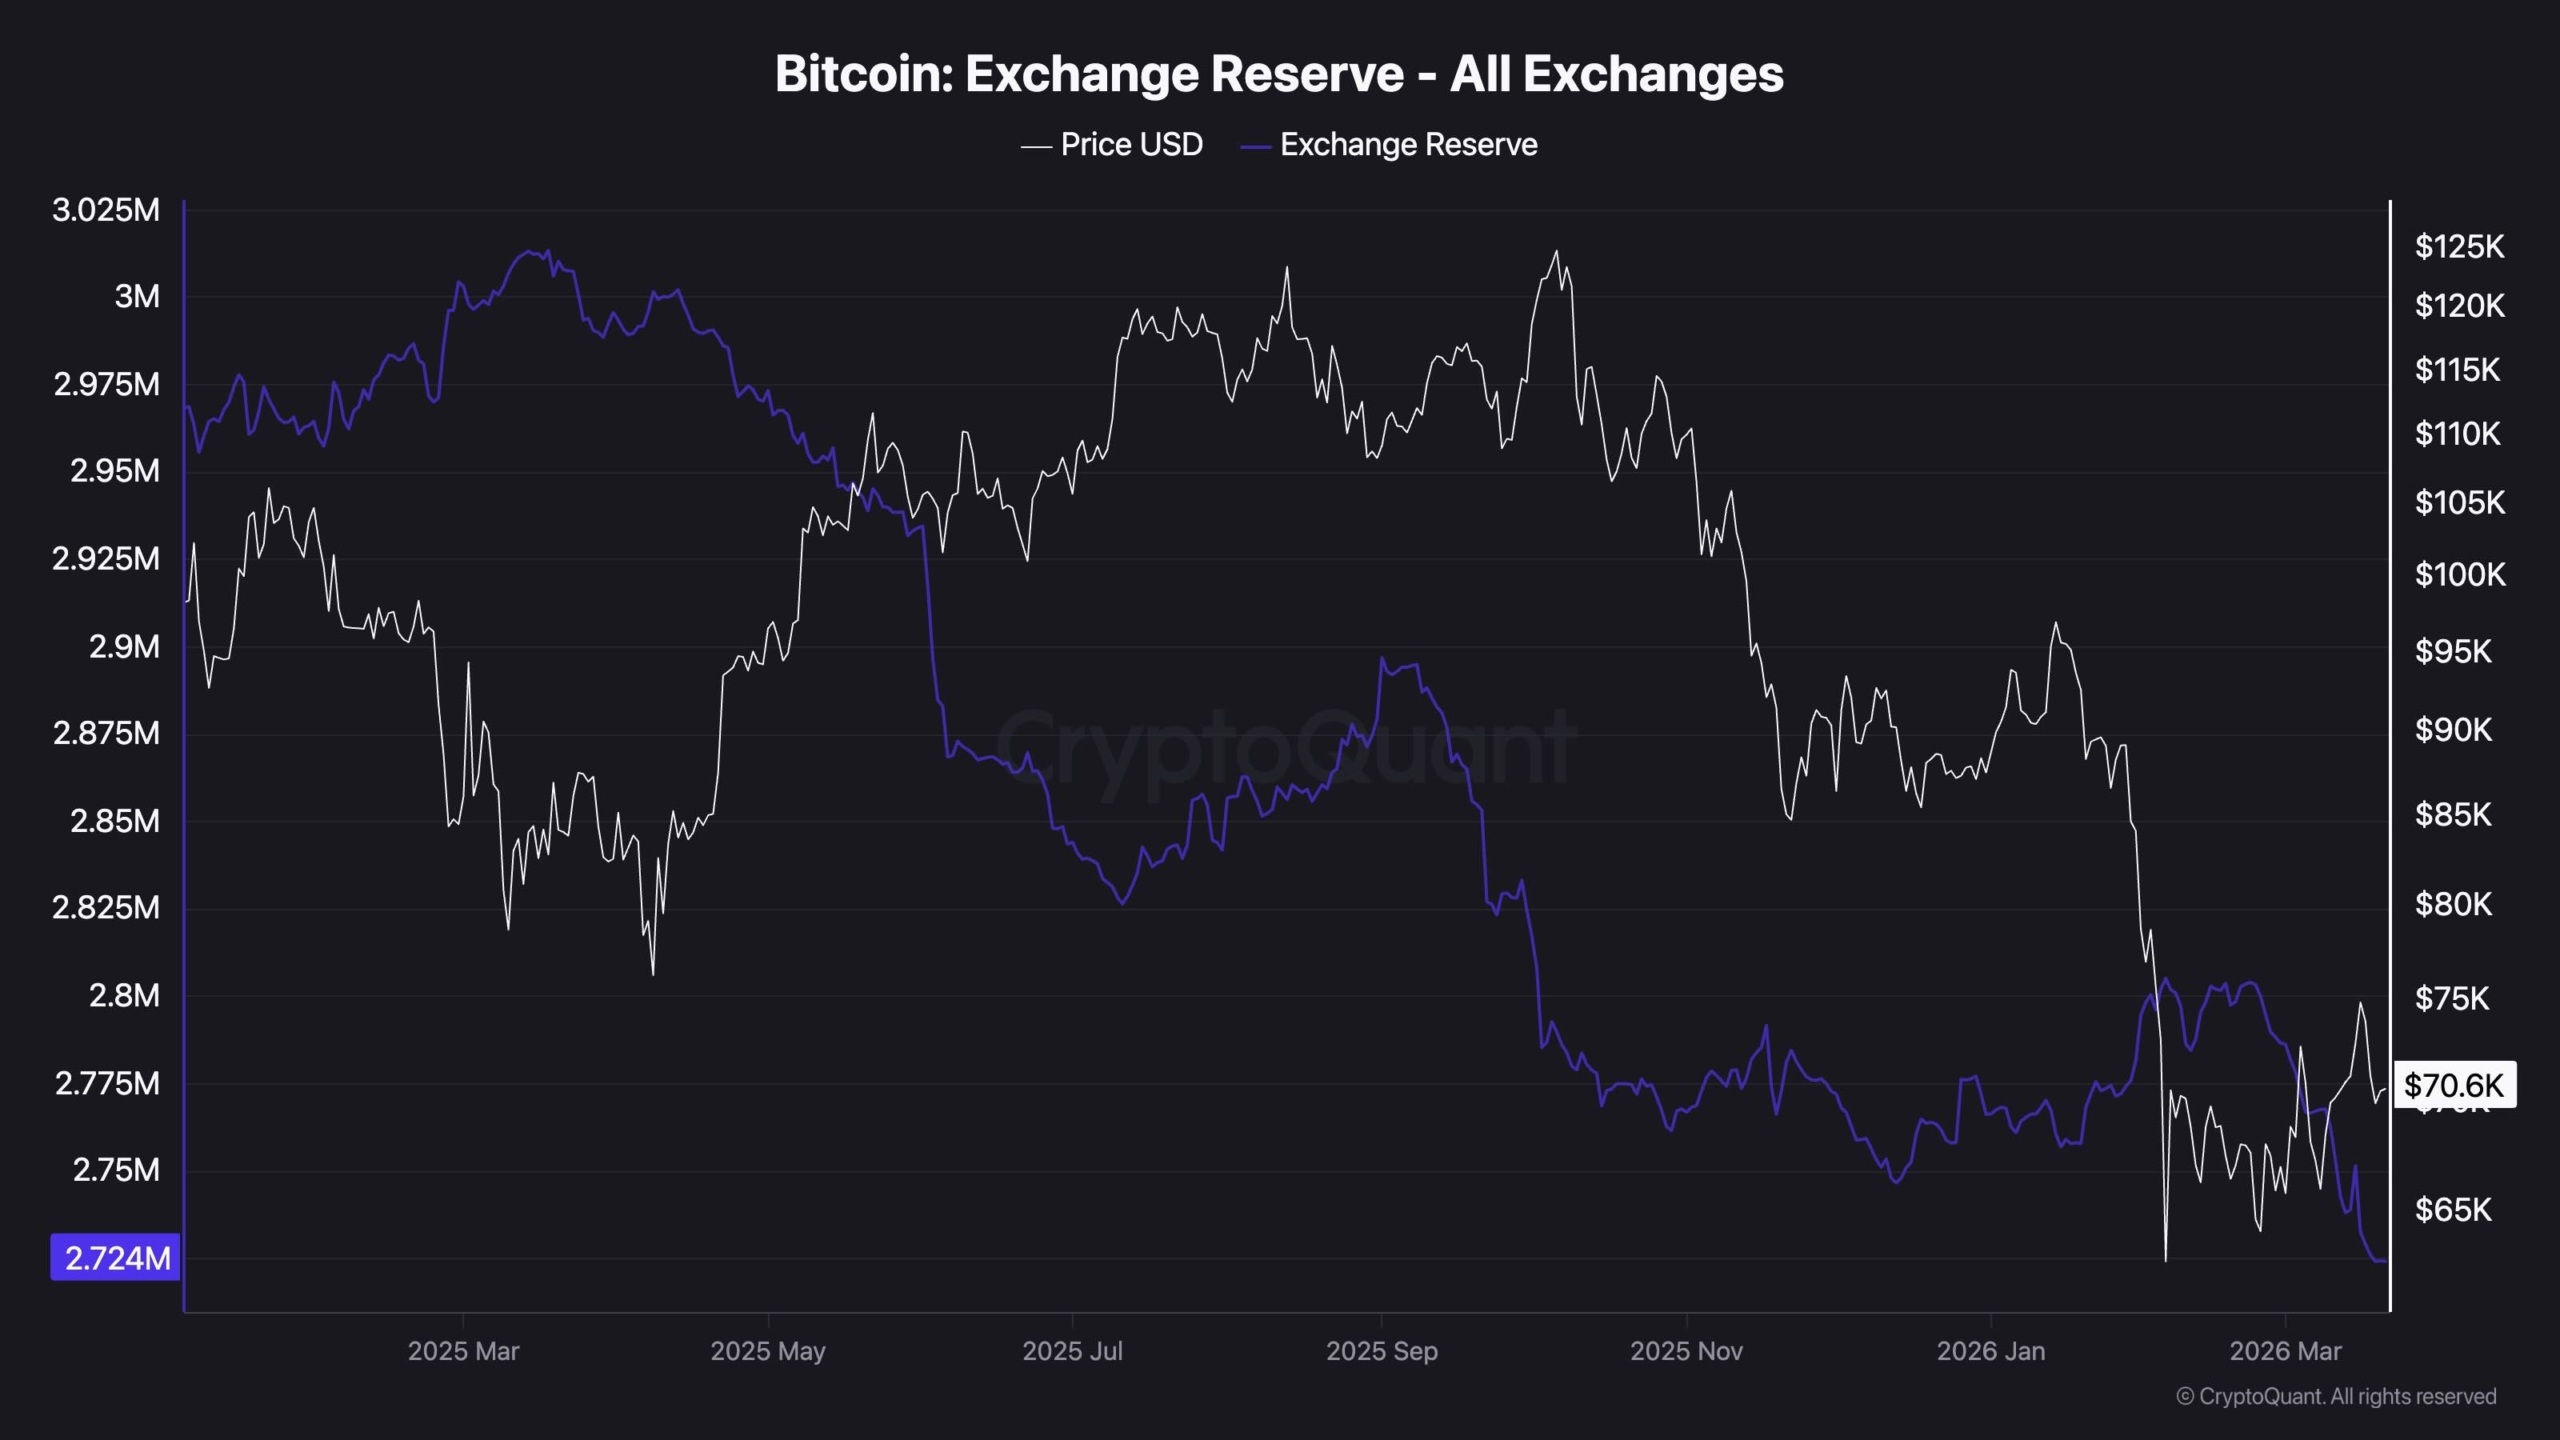
On-Chain Data Insights
The on-chain metrics continue to present encouraging signs. Over recent weeks exchange reserves have plummeted sharply—a steep decline during periods marked by consolidation typically indicates accumulation rather than frantic distribution among traders. In essence—even while prices remain stagnant struggling against established support or resistance levels—coins are being withdrawn from exchanges at accelerated rates.
This scenario often signals positive underlying conditions since it implies participants are withdrawing $BTC, indicating they are not positioning themselves for immediate sales transactions instead focusing on holding assets long term . The initial weeks reflecting reserve declines hold particular significance here aligning closely with phases characterized by steady absorption beneath surface-level trading activity . Therefore , despite facing technical resistances reflected across charts , trends concerning reserves suggest ongoing accumulation which could provide supportive conditions if buyers eventually succeed in catalyzing breakouts ahead .