On March 18, 2026, Bitcoin experienced a decline, trading below $71,000 after reaching an intraday low of $70,767 shortly before 11 a.m. EST. This movement occurred within a broader range of $70,767 to $74,836 and places the price right at a significant support level. Technical indicators are showing increasing strain across shorter timeframes.
Bitcoin Price Analysis
The current price action indicates that it is undergoing a more profound test of support rather than merely experiencing a temporary pullback. The daily chart continues to depict Bitcoin within an overarching upward trend; however, the margin for error has significantly decreased.
The importance of maintaining levels above the $70,000–$71,000 area is no longer just theoretical—it is actively being challenged. With market capitalization hovering around $1.43 trillion and daily trading volume at approximately $41.47 billion, liquidity appears stable; however, this participation has not yet translated into any upward momentum.
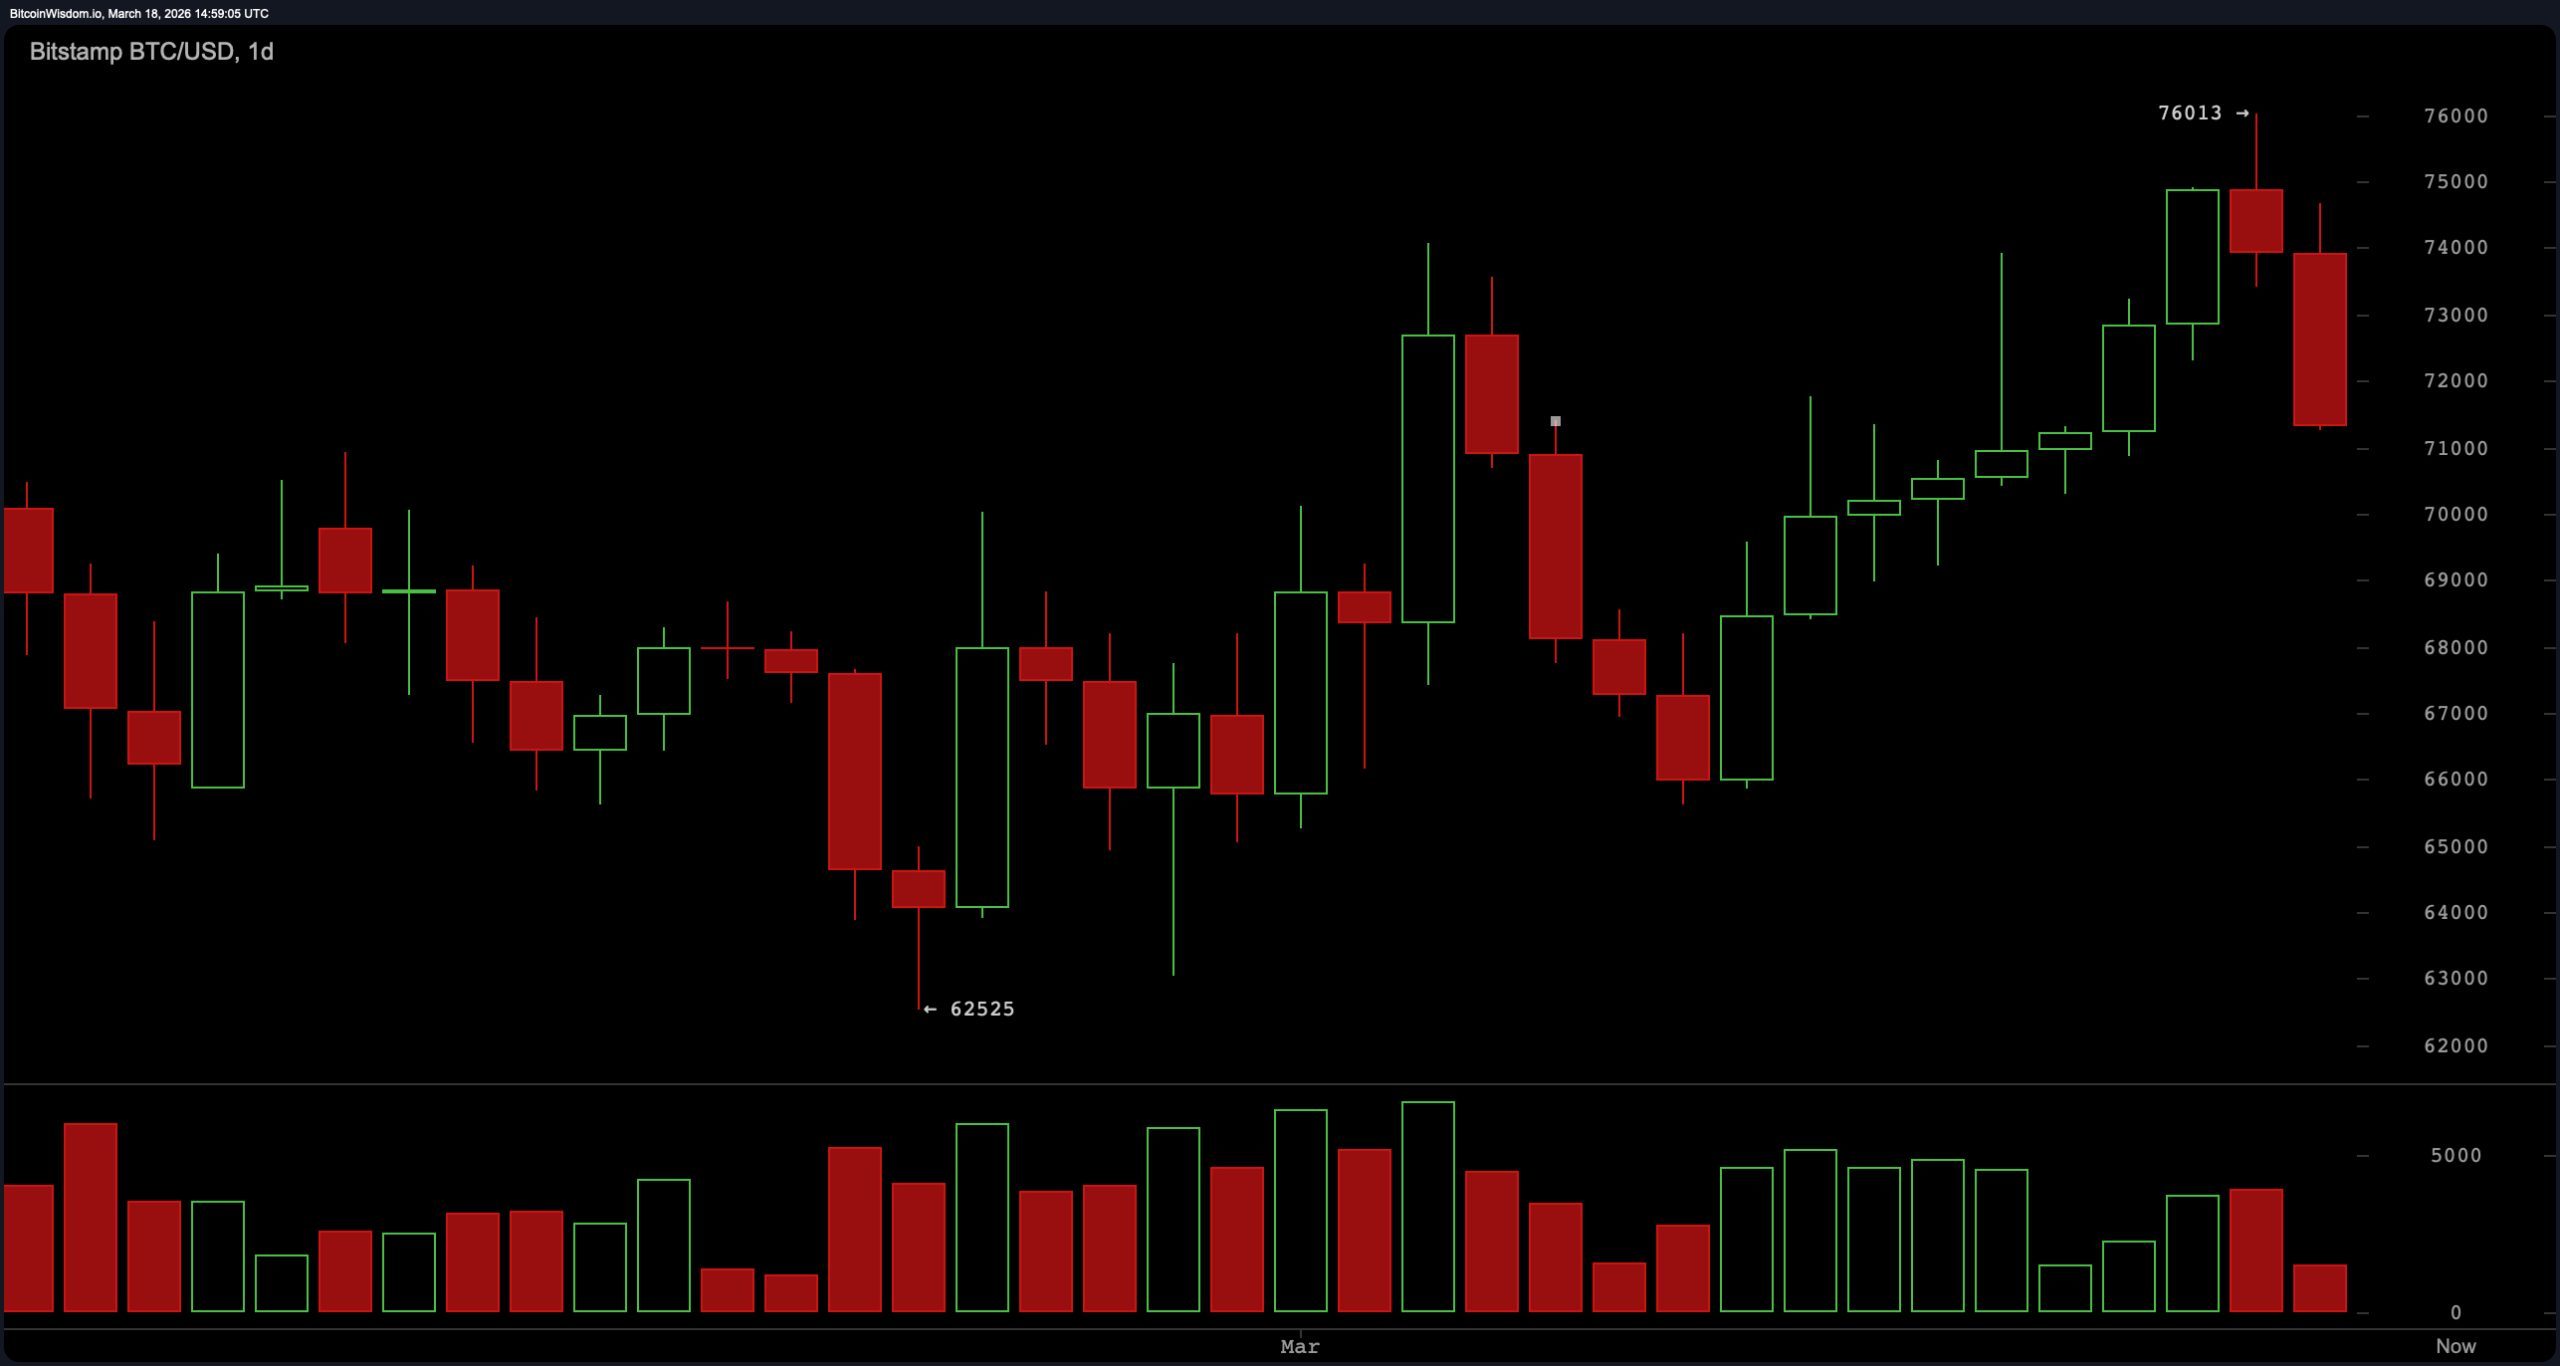
$BTC/USD one-day chart via Bitstamp on March 18th.
The four-hour chart reveals further deterioration in structure as earlier consolidation gives way to directional pressure following rejection near the resistance level of approximately $74,800. Lower highs persist while the drop towards $70,767 confirms that sellers have gained control in the short term. The previously established resistance zone between $73,000 and $74,000 now clearly acts as such with prices remaining below the critical threshold of $71K—indicating this range is no longer neutral but rather under stress.
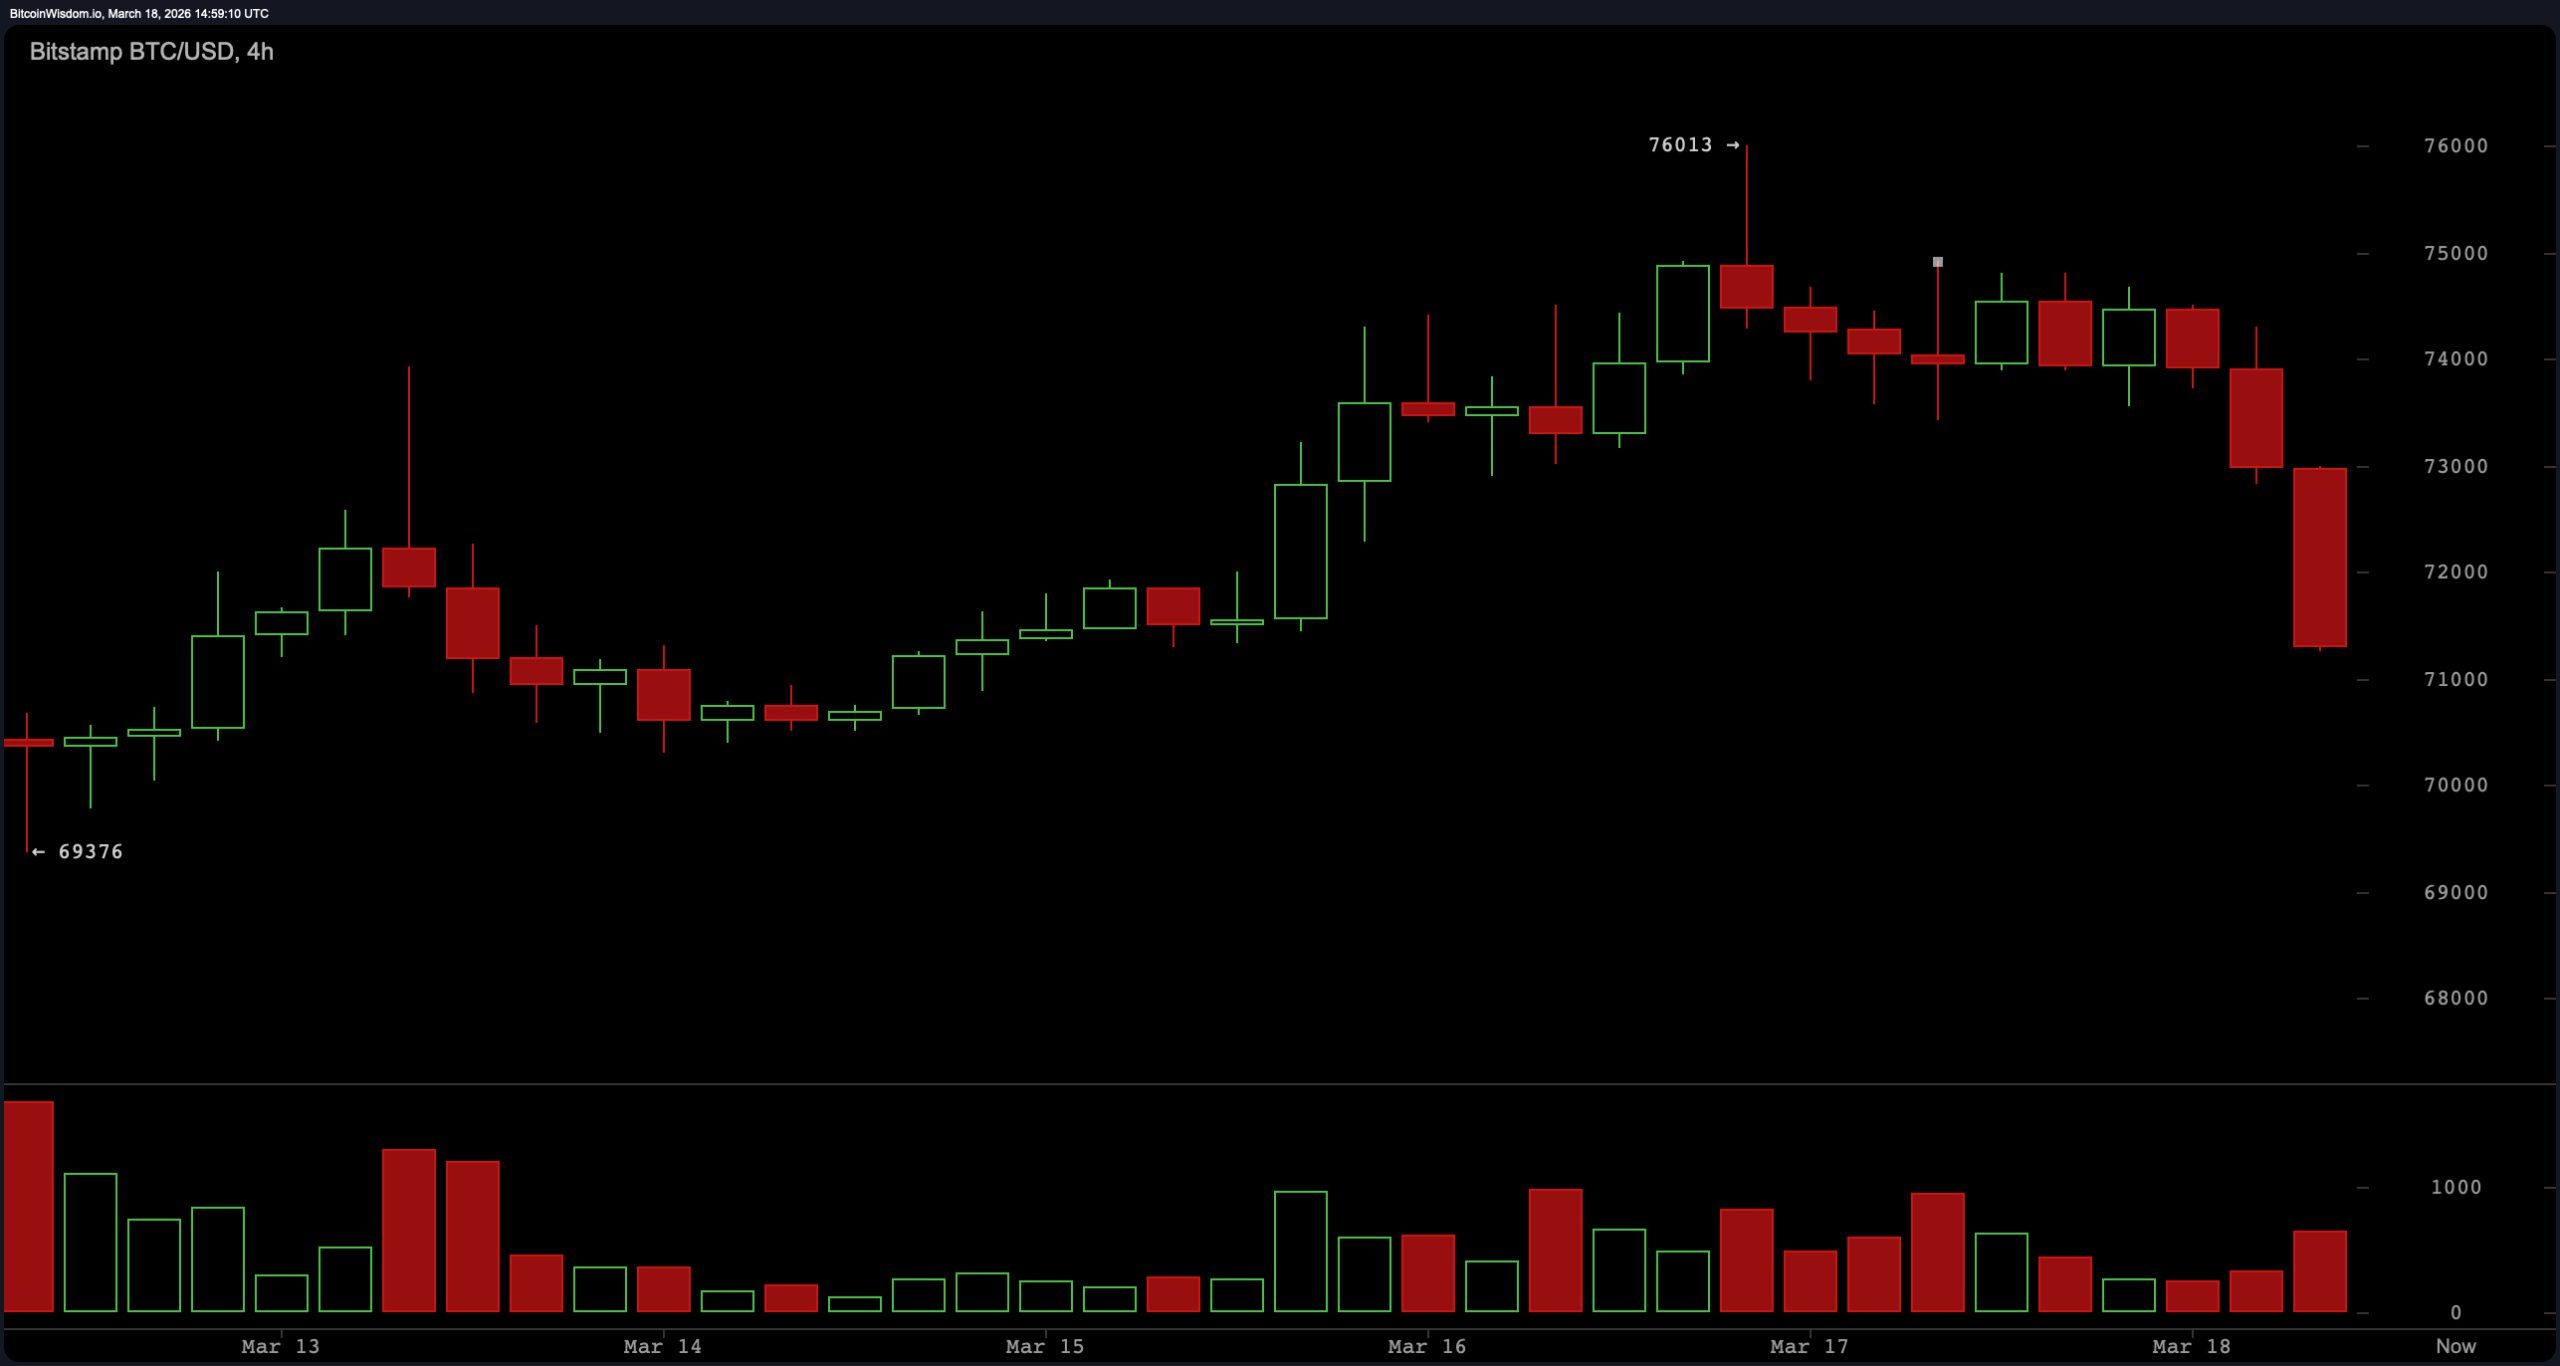
$BTC/USD four-hour chart via Bitstamp on March 18th.
Analysis from the one-hour chart shows ongoing downward momentum without any significant recovery bounce after hitting lows around $70K+. Oscillators reflect indecision with bearish tendencies prevailing; for instance: while RSI remains neutral at 52—lacking conviction—the Stochastic indicator sits high at 79 without providing reversal signals either way. Additionally: CCI stands at 85 and ADX measures weak trend strength overall (at just 26). Momentum indicators continue signaling sell conditions despite MACD still printing buy signals—resulting in mixed messages for traders amid declining prices.
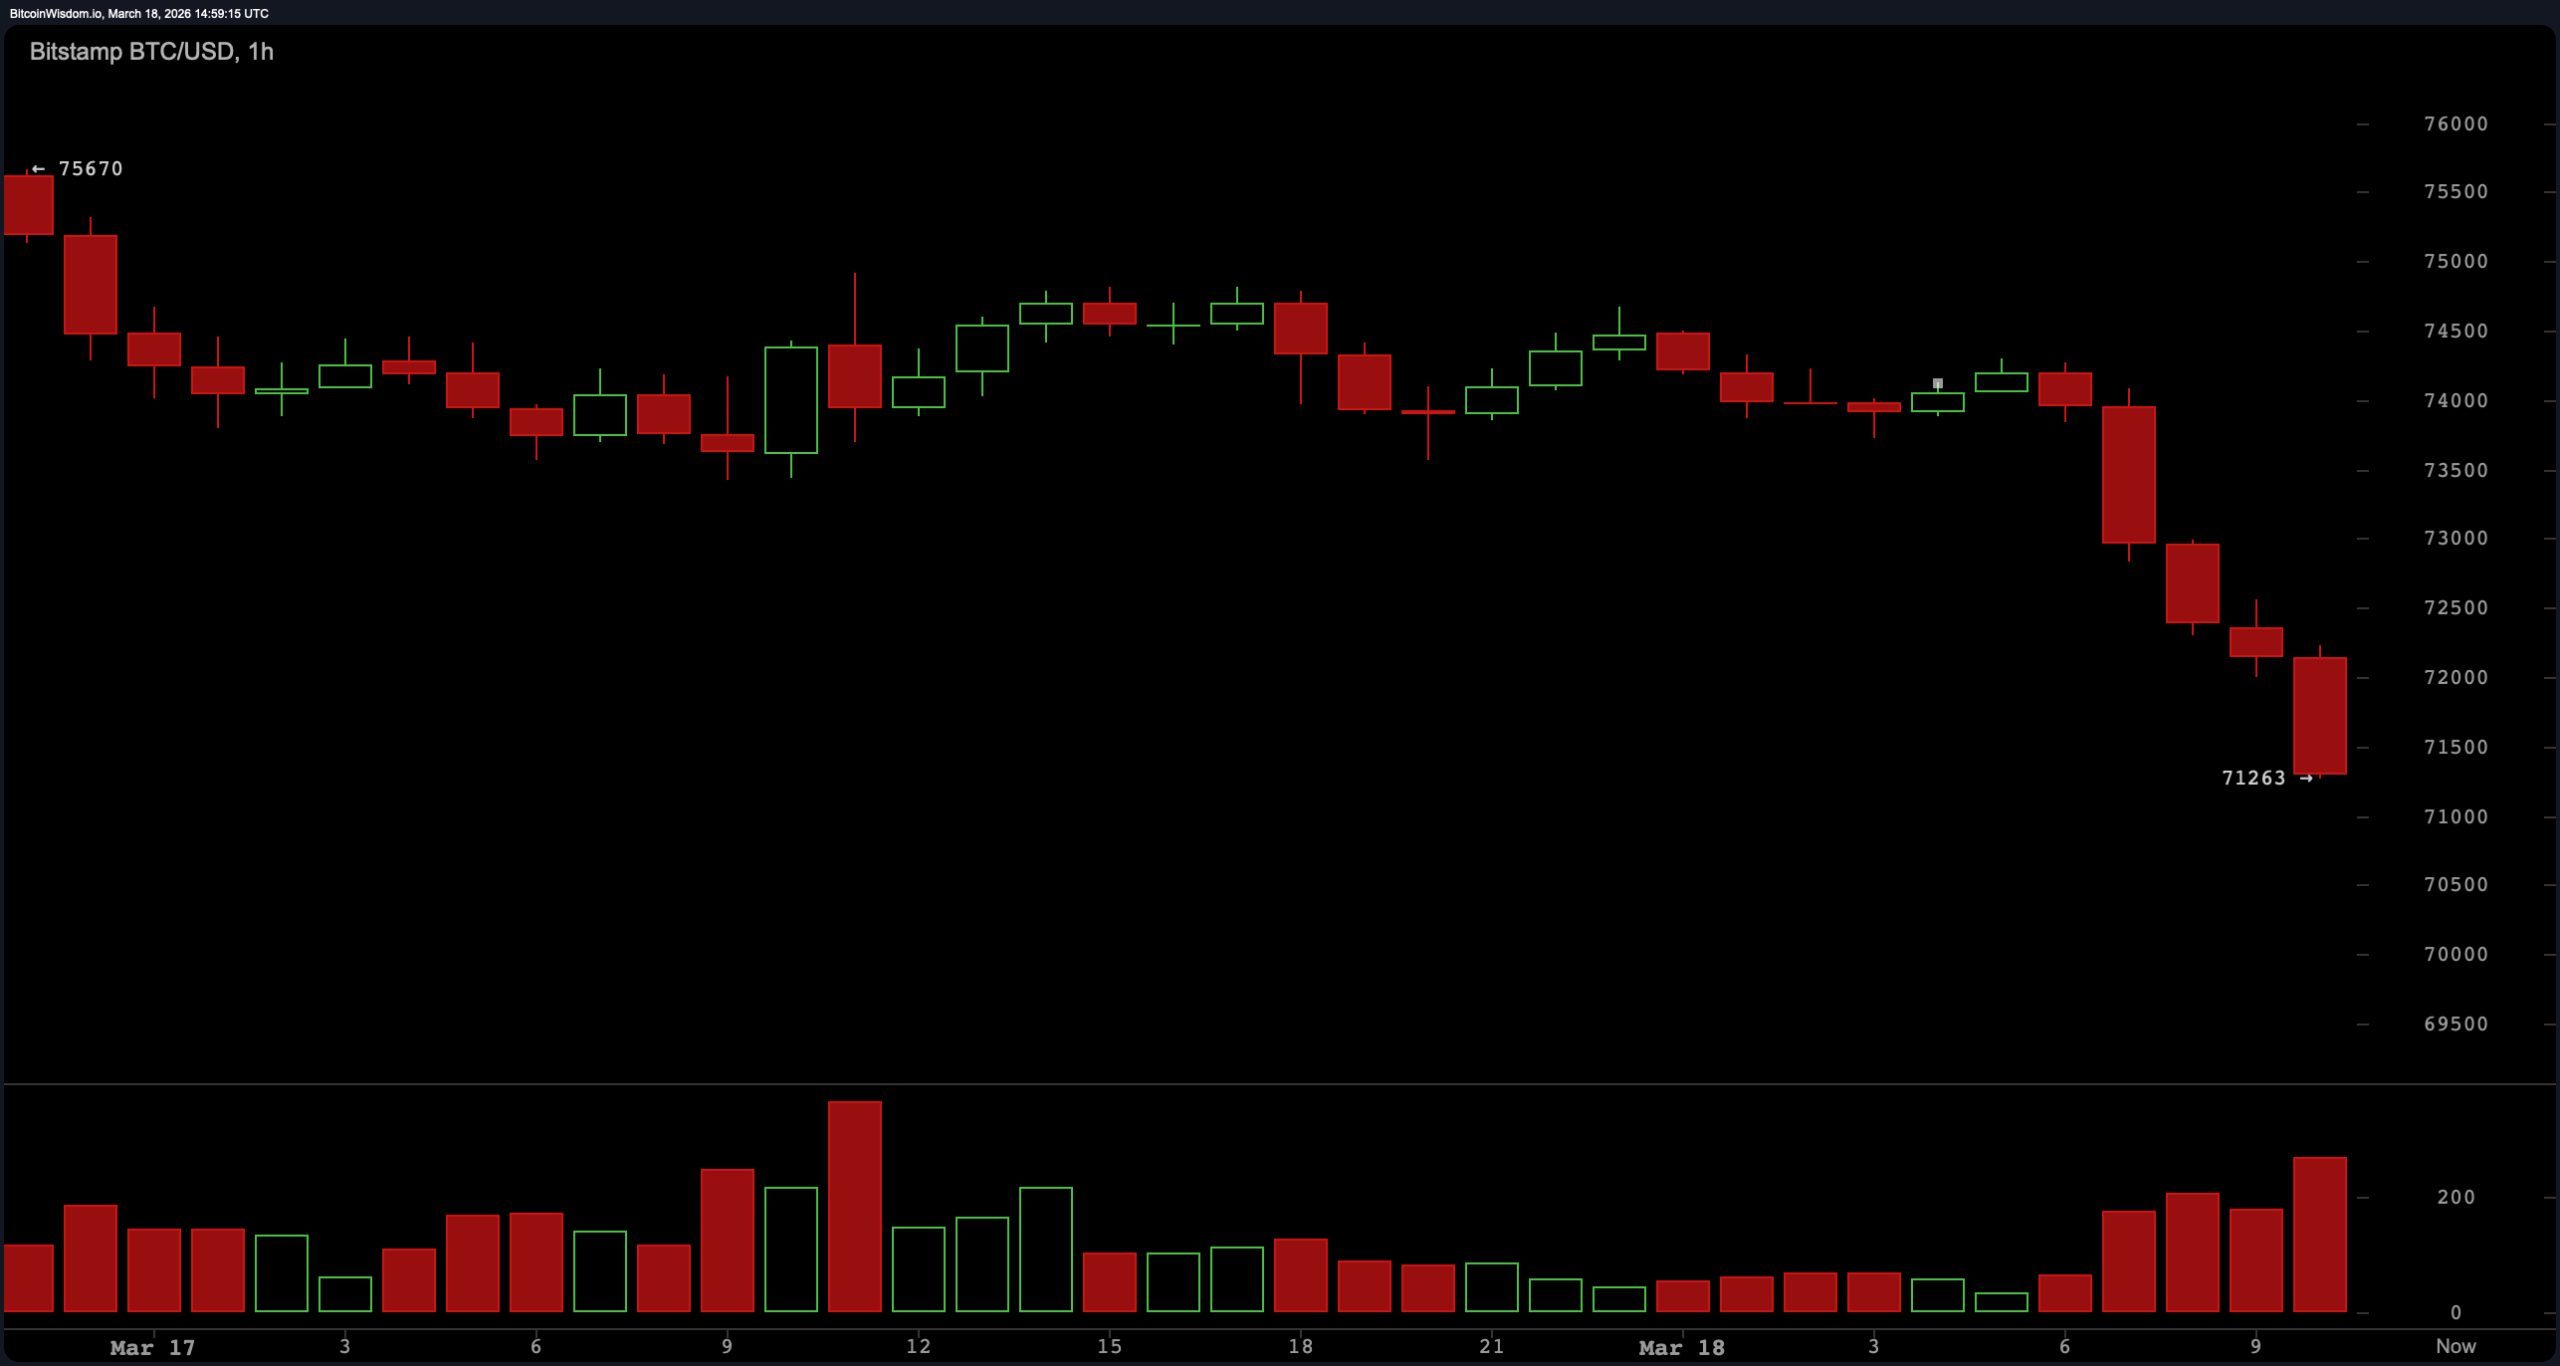
$BTC/USD one-hour chart via Bitstamp on March 18th.
Moving averages highlight tensions between immediate selling pressure versus underlying support levels—the ten-period EMA currently rests above price (at about $71K) indicating bearish bias while its simple moving average counterpart has lost its supportive function altogether (currently sitting around $71K). Below current pricing lies various EMAs/SMA clusters forming layered supports actively being tested including: twenty-period EMA ($70k), twenty-period SMA ($69k), thirty-period EMA ($70k) & thirty-period SMA ($68k).
Meanwhile higher timeframe averages such as fifty-period EMA situated near $72K along with other major averages up until about $93K remain capping attempts towards upside breakthroughs too!
In summary: Bitcoin’s status shifted from neutrality into precarious testing territory concerning crucial supports! While daily trends haven’t broken down yet – four hour charts show clear weakening signs whereas hourly ones remain pressured heavily downwards! Oscillator readings appear mostly neutral—but actual price movements suggest otherwise—not particularly optimistic either… The pivotal line now resides firmly placed right around that psychological mark known simply as “seventy thousand dollars.” Market sentiment hovers closely over where narratives can shift rapidly!
Bullish Perspective:
If Bitcoin manages to hold firmly above seventy thousand dollars especially if reclaiming ranges between seventy-one thousand five hundred through seventy-three thousand five hundred would reinforce bullish corrective pullbacks paving pathways back toward resistances found somewhere within those zones marked off by seventy-four-thousand through seventy-six-thousand dollar thresholds!
Bearish Perspective:
A decisive breach beneath that critical barrier could confirm losses regarding structural supports leading potentially downward trajectories targeting sixty-eight-thousands or even extending corrections deeper into mid-sixty thousands regions!
Frequently Asked Questions 🔎
Why did bitcoin drop below seven-one K today? This decline followed short-term momentum weakening alongside persistent resistance found near seven-four-eight-hundred dollar marks holding firm against advances made earlier during trading sessions today!
What’s currently considered key support level? $70000 remains pivotal since recent pressures led us directly onto testing grounds here again recently amidst volatile shifts occurring throughout market dynamics lately…
Is bitcoin still trending upwards overall?</ strong> ;> ;</ span> ;<br / > ; Yes indeed although day-to-day fluctuations reveal signs suggesting weakening structures emerging presently affecting shorter timeframe perspectives observed across charts themselves…
What happens if BTC breaks past key mark set upon previously mentioned? & lt;/ strong >& gt;& lt;br / & gt;Should we witness breaches beneath those levels then likely triggers cascading effects pushing values lower targeting areas surrounding sixty-eight thousands potentially leading corrections heading even deeper perhaps nearing mid-sixties region ultimately.