
On March 16, 2026, at approximately 11:15 a.m. EST, Bitcoin was trading at around $73,764. The cryptocurrency experienced fluctuations within a range of $71,389 to $74,387 over the previous 24 hours. With a market capitalization of $1.46 trillion and trading volume reaching $48.85 billion during that period, data from March 16 indicates that Bitcoin is positioned towards the higher end of its session range while short-term charts depict consolidation just beneath nearby resistance levels.
Bitcoin Chart Analysis
The daily chart illustrates that Bitcoin has been maintaining its position within the same verified intraday band; price movements have remained between $71,389 and $74,387 in the latest session. The market continues to hover in the upper section of this range as trades cluster around the area between $73,000 and $74,000.
Key reference points visible on this chart include significant markers at levels such as 75,000; 83,500; and 87,500 for potential upward movement while lower reference points are noted around values like 73,500; 73,000; and near the region of 72,500. In this context,the daily timeframe suggests price stabilization within this broader range rather than indicating any decisive breakout beyond session highs.
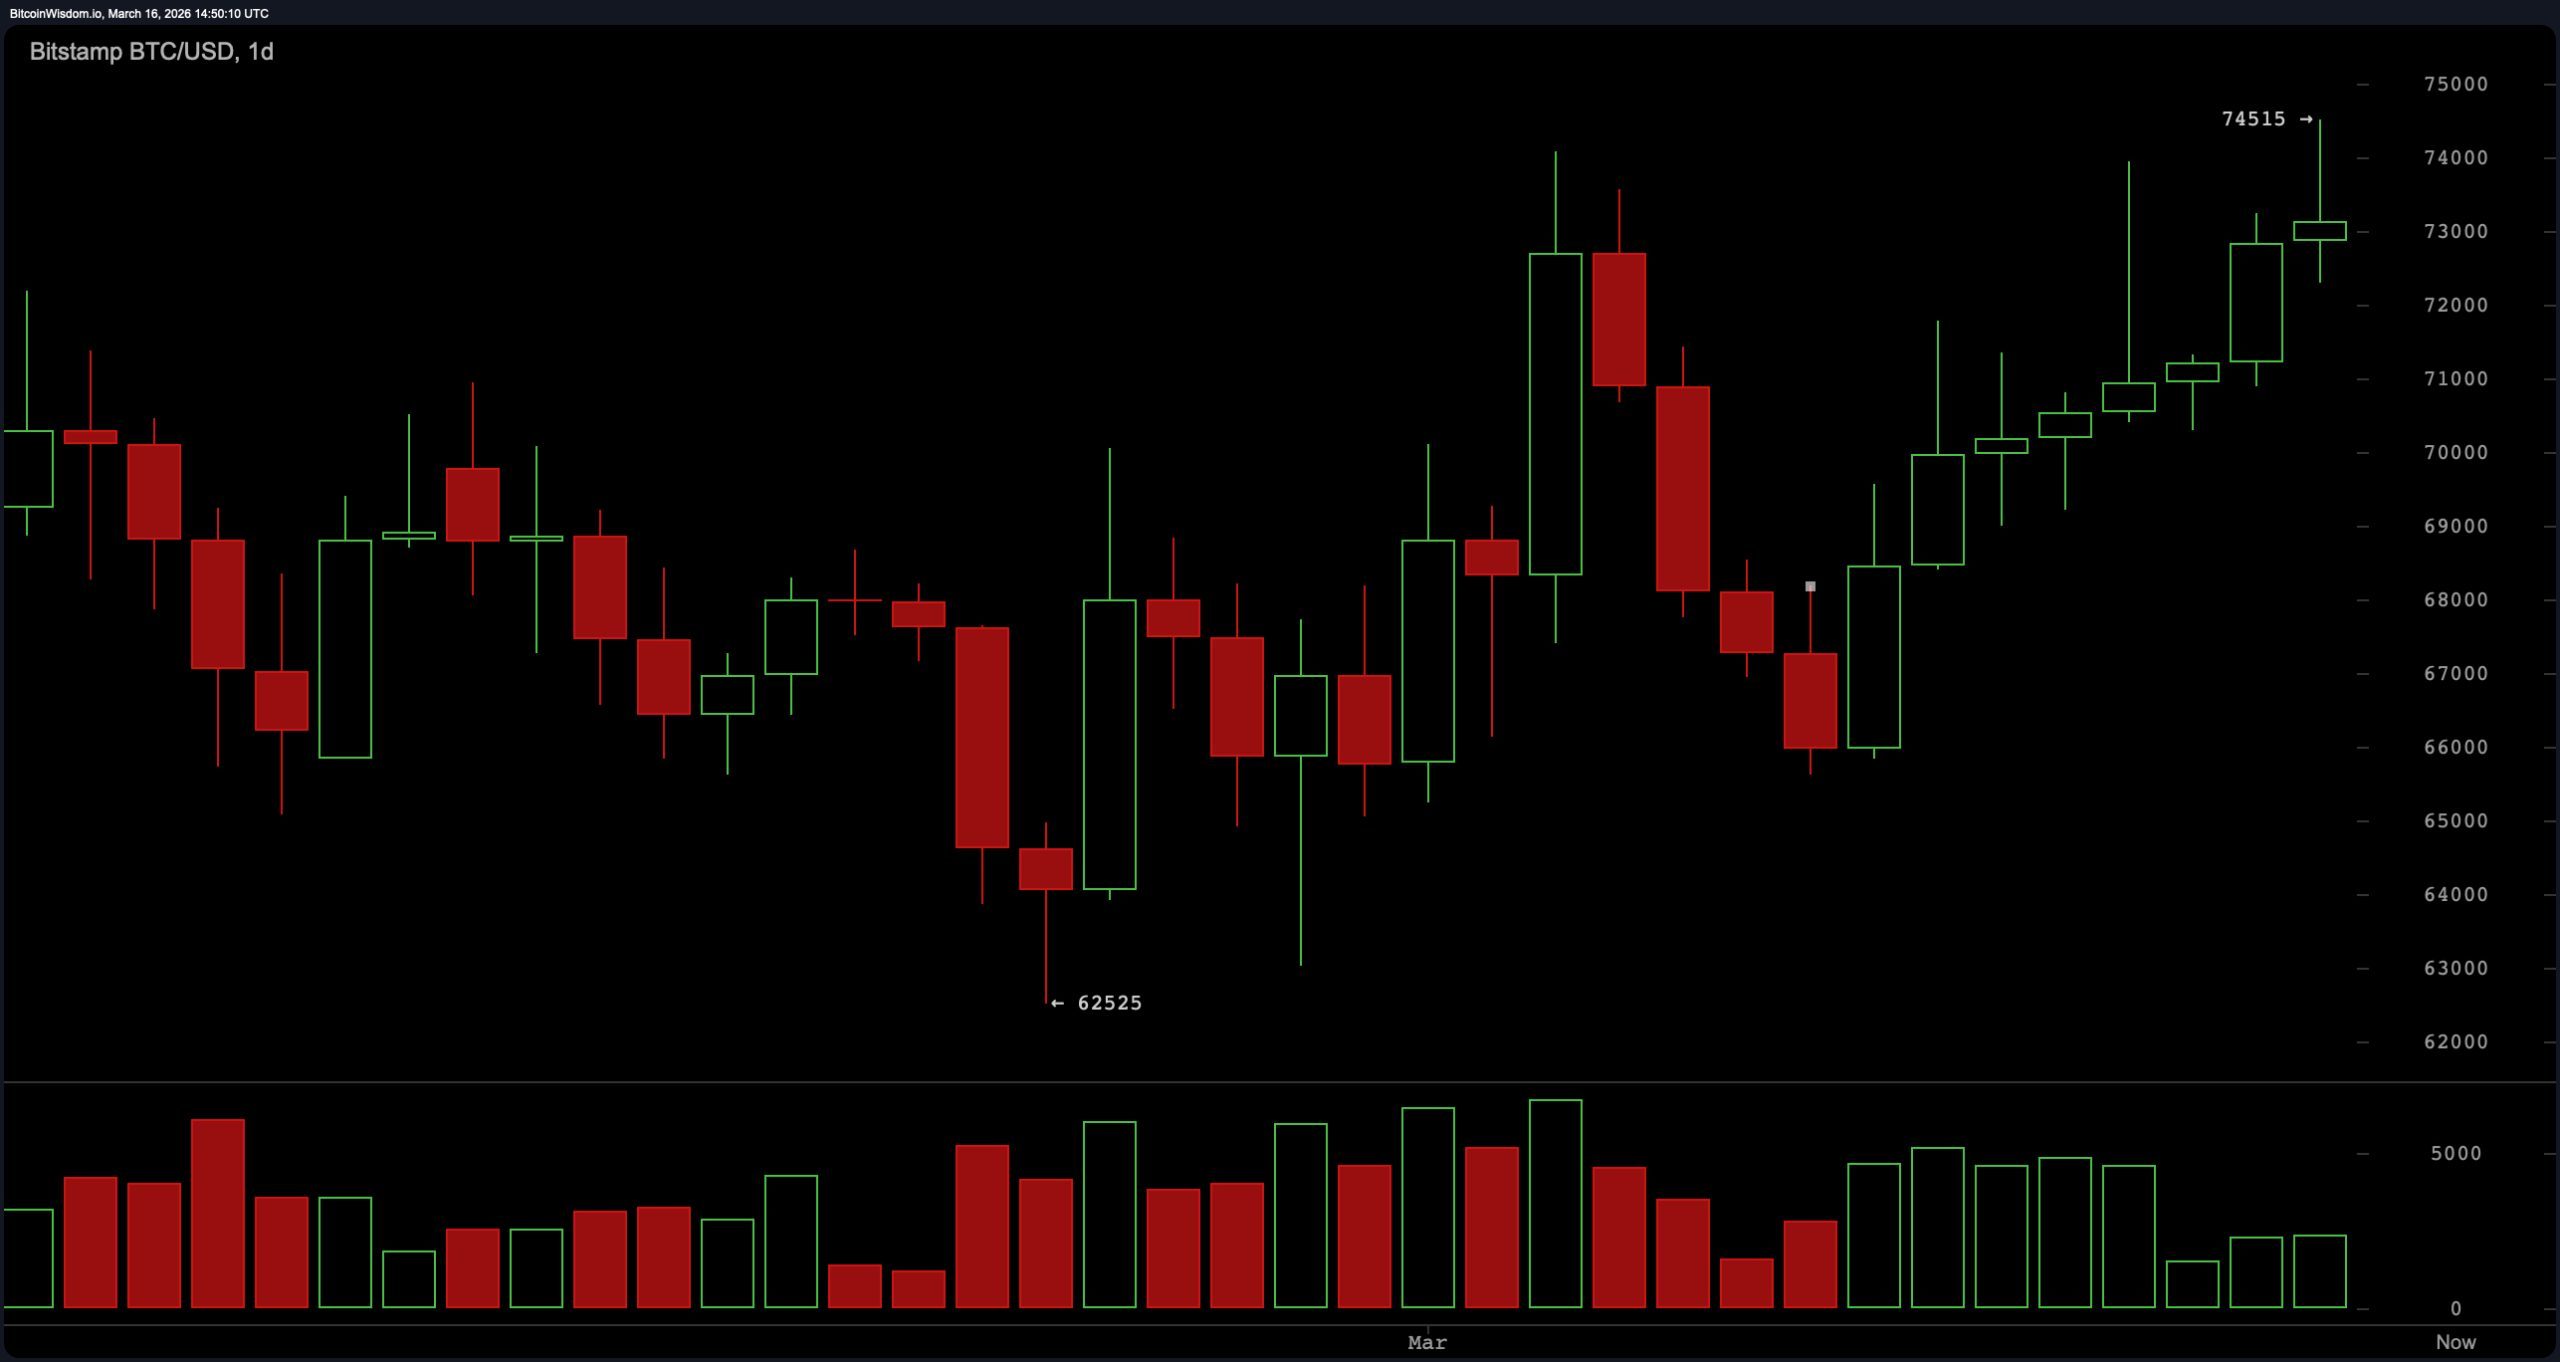
$BTC/USD one-day chart via Bitstamp on March 16th.
The four-hour chart reveals that Bitcoin’s price activity is consolidating near the region between approximately $73,800 and $73-851 based on Bitstamp’s recent movements. Recent ticks indicate sequential trades occurring within this narrow band which suggests short-term compression following an earlier push toward higher session limits.The current short-term price structure remains above several lower moving average clusters identified in data ranging from about$68-72k.The four-hour timeframe therefore depicts sideways movement near resistance instead of retracing back toward deeper support levels.
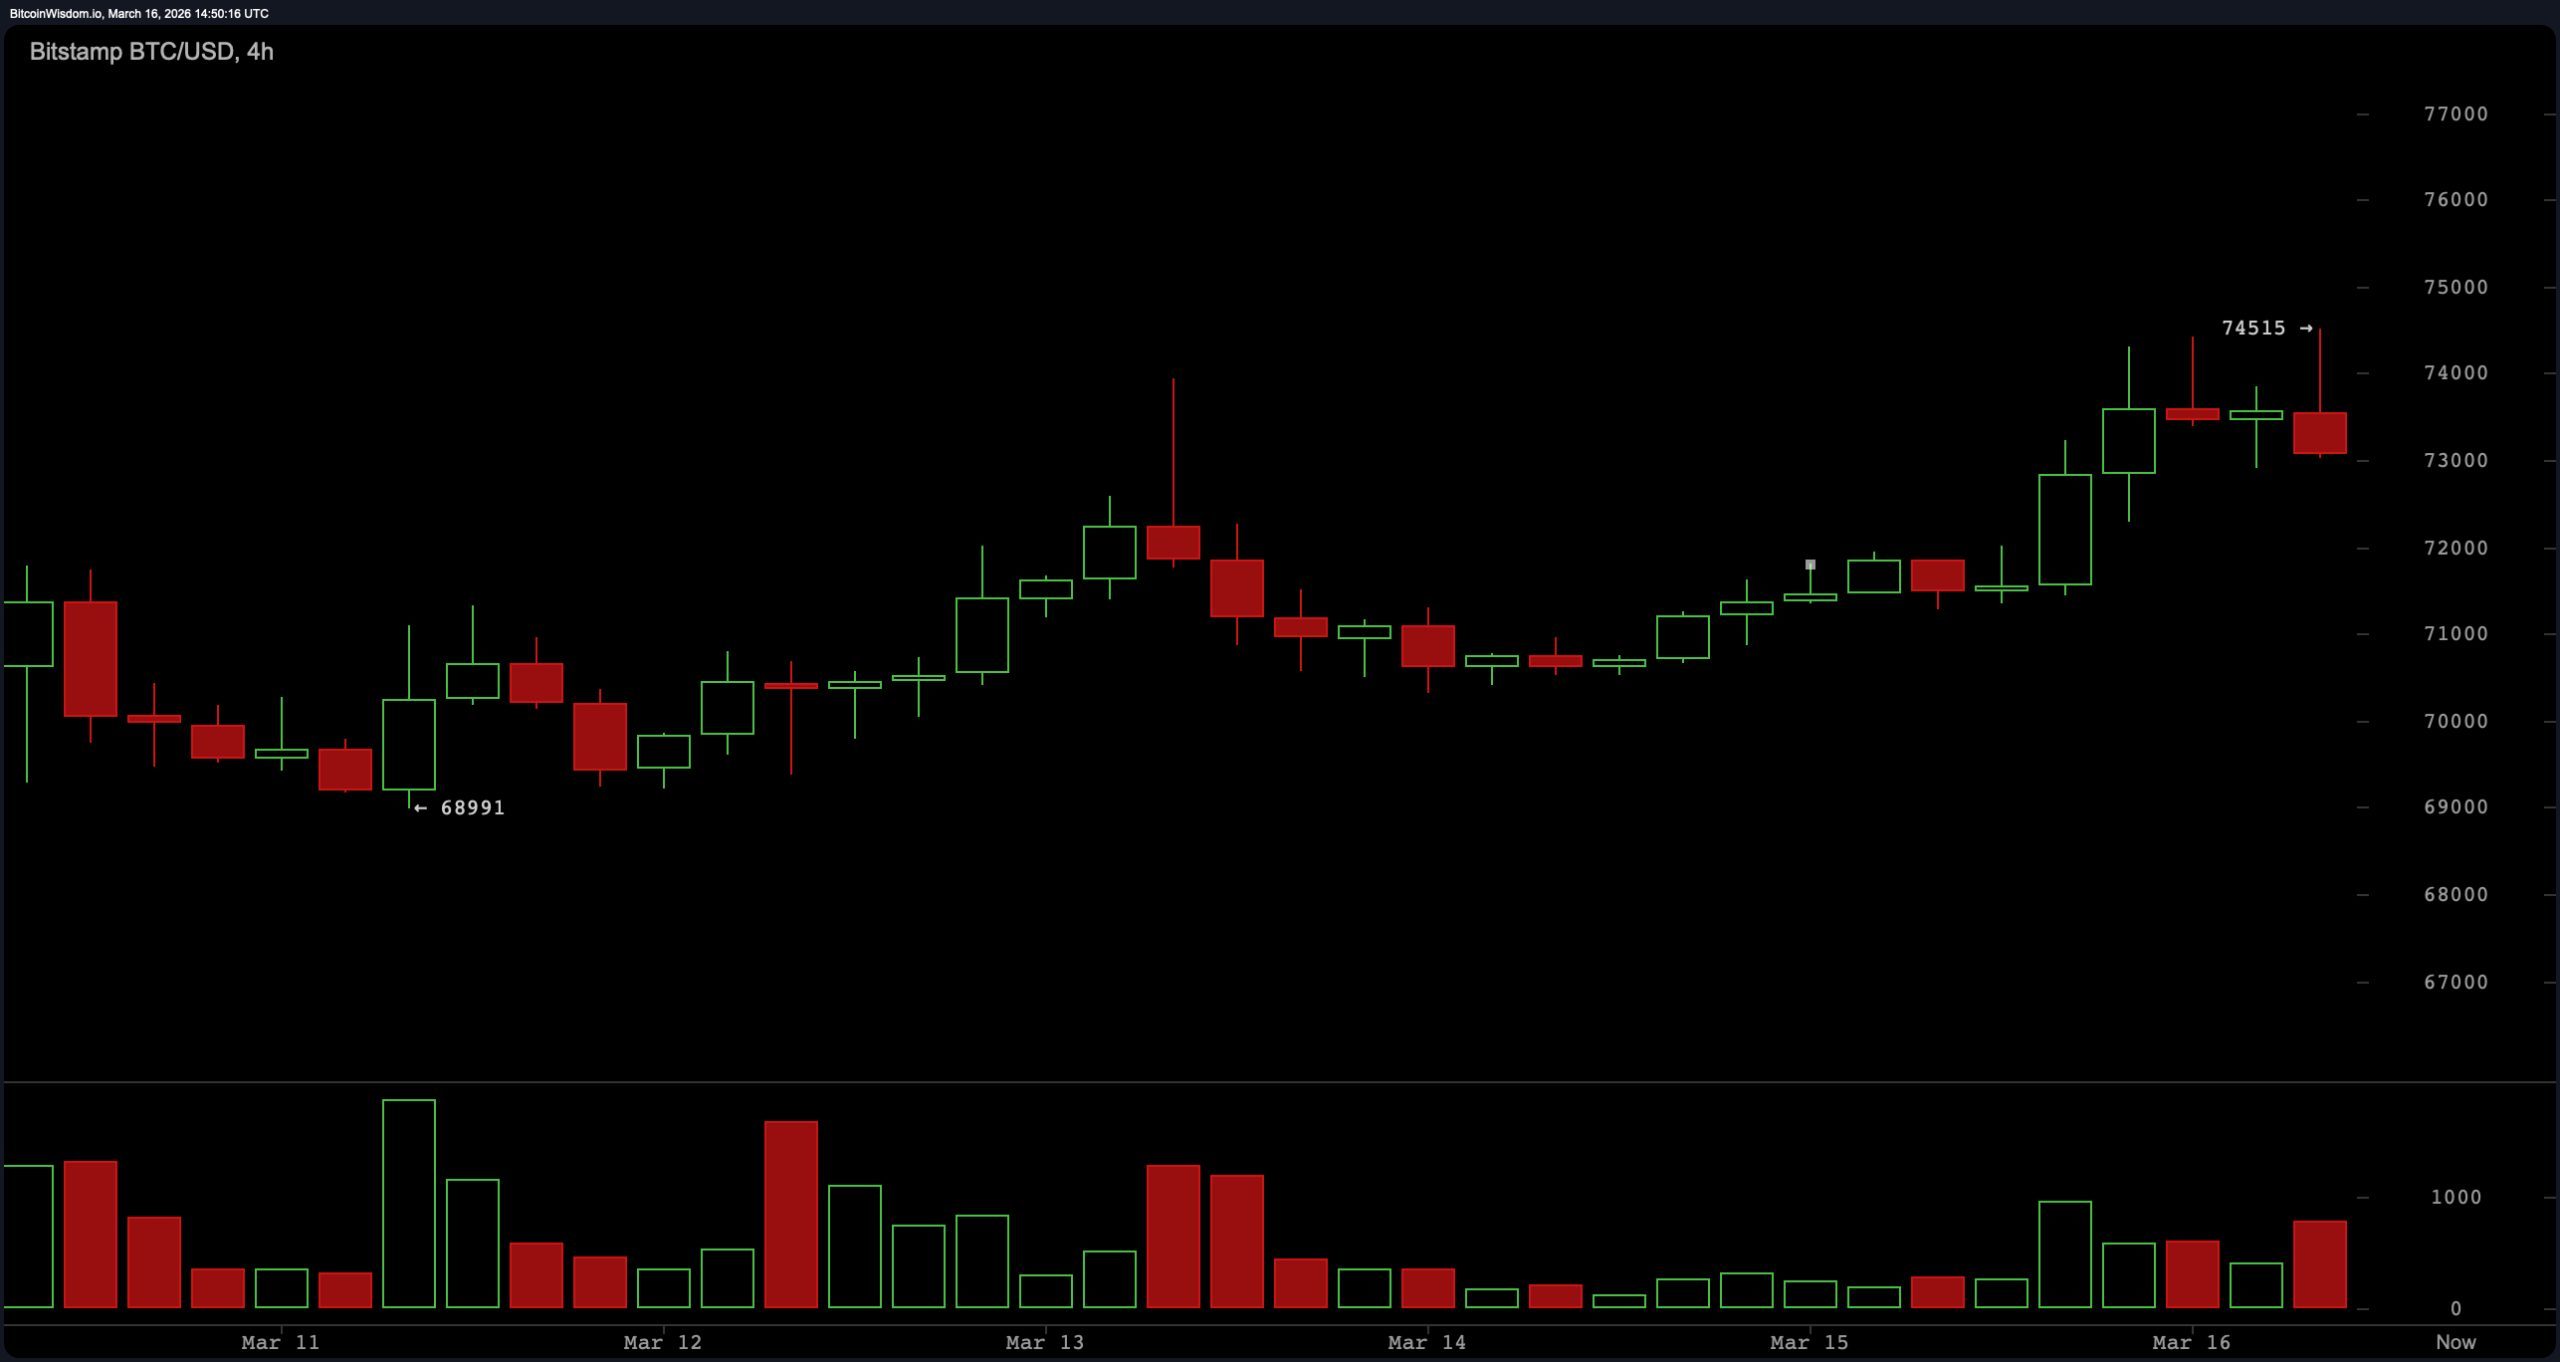
$BTC/USD four-hour chart via Bitstamp dated March sixteen.
The one-hour chart similarly illustrates ongoing consolidation with prices fluctuating consistently in the upper zone around$73k.Immediate order-book levels indicated most recent transactions occurred roughly between$73800-$73851 with buy/sell averages recorded close to$73829/$73791 respectively.Currently these positions place trading slightly above both averages although differences remain minimal thus reflecting narrow pricing movements confined within defined bands hovering just below peak sessions marks.
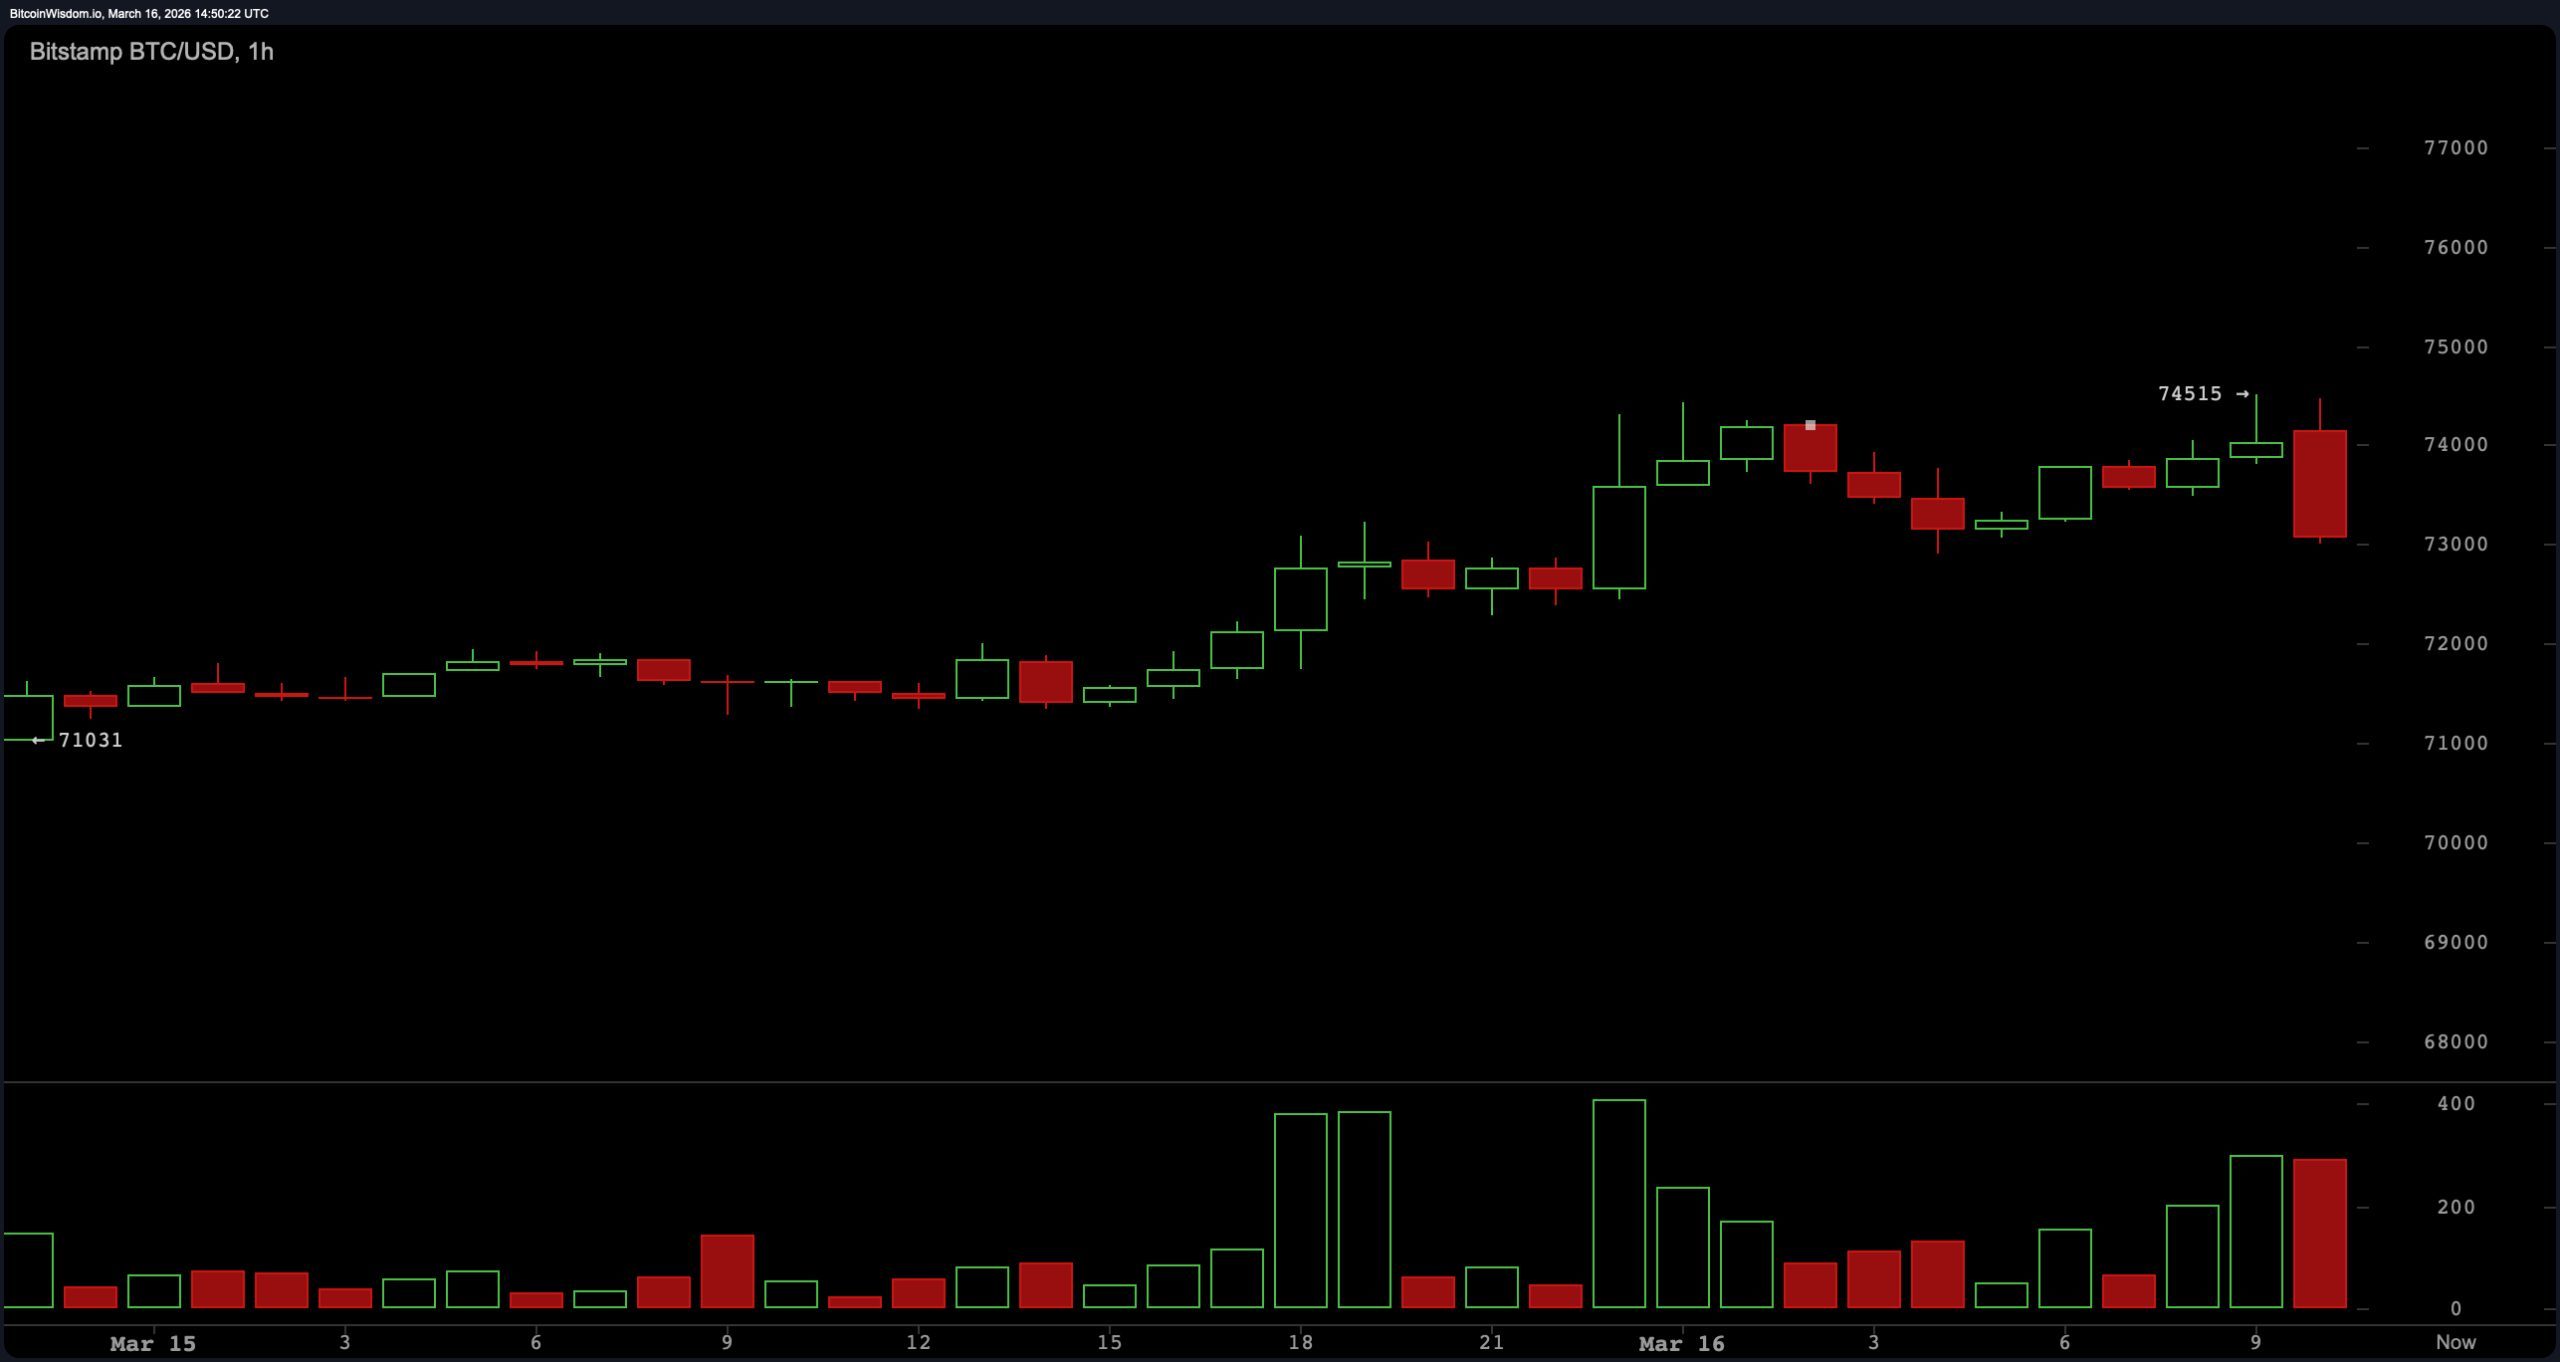
$ BTC / USD hourly graph through Bitstamp dated Mar ch sixteenth .
Oscillator readings show an overall neutral stance across indicators where relative strength index (RSI) stands at59 , stochastic measures80 , commodity channel index (CCI) records142 each categorized under neutrality according to datasets analyzed.Average directional index(ADX ) holds steady at25 also labeled neutral suggesting moderate trend strength overall .
The Awesome oscillator registered3 ,282 likewise remaining neutral.Two indicators diverged slightly from neutrality ; momentum indicator(10 ) marked5 ,076 whereas moving average convergence divergence(MACD)(12 ,26 ) printed364 signaling positive momentum based upon technical summaries examined .
Moving averages appear supportive over shorter periods yet longer term figures remain elevated above current pricing structures.Exponential moving average(EMA) shows EMA(10)at70 ,818SMA (10)at70 ,054 ;EMA (20 )at70 ,012SMA (20 )at69 ,175 ; EMA(30) standing tall @70,447SMA(30)@68,476;while50-periods EMA rests comfortably @72,799 alongside SMA(@71 ,119).Longer terms averages maintain their height including100-periodsEMA($79 ,412)& ;100-periods SMA ($80 ,613);200 periods’EMAs reach87,686with200-SMAs touching93 ,738Overall signals across summary datasets continue pointing positively .
Bullish Perspective:
Bitcoin remains positioned close towards top portions throughout its twenty-four hour ranges whilst sustaining distances exceeding various shorter-moving averages falling roughly anywhere amidst68K& amp;72K.Momentum indicators inclusive but not limited too MACD &;momentum indicator marking positive signals along RSI lingering below overbought territories sitting right about59.As prices consolidate beneath peaks hitting74 ,38736 >;above50-period exponential MA resting comfortably @72 ،799 technical structures reflect stability resting against resistances instead deteriorations should they hold firmly up here then testing upper boundaries could persist ahead!
Bearish Perspective:
Even though trading occurs quite closely adjacent atop day’s ranges,Bitcoin still lingers beneath numerous long-lasting MA’s significantly towering high past present value figures.Having100periodEma($79 ،412),the hundred simple MA(sitting right next)$80 ،613,two-hundred EMAs nearing88K,and two-hundred simple ones hitting94K all remain overhead.Oscillators broadly classified neutrally including RSI&stochastic % K commodities channels indices ADX awesome oscillators suggest limited trends prevailing.With prices consolidating just shy away beyond peaks rather than breaking through them markets continue operating inside confines without establishing clear breakouts confirmed yet!
Frequently Asked Questions 🔎
What was bitcoin priced on March sixteen twenty-six? On march sixteen year twenty-six bit coin traded approximately seventy-three thousand seven hundred sixty-four dollars during eleven fifteen AM EST ranging itself somewhere inside those numbers seventy-one thousand three hundred eighty-nine point sixty-five cents upwards till seventy-four thousand three hundred eighty-seven point thirty-six cents !
Is bitcoin currently trending upwards or downwards? A glance into short term charts showcases bitcoins positioning solidifying closer towards higher ends meanwhile holding well above several other shorter termed moving aversions !
What do today’s technical metrics indicate regarding bitcoins performance? A majority amongst oscillators appear stable enough showing no drastic changes whilst momentum measures along with MACDs provide signs indicating positivity throughout today’s observations!
Which critical thresholds should traders keep an eye out for concerning bitcoin ?This ongoing session hit highest mark reaching up until seventy-four thousand three hundred eighty-seven acts immediately resisting forces while neighboring supports lie scattered nearby observing thresholds like seventy-three-thousand five-hundred/seventy-three-thousand/seventy-two-thousand five-hundred respectively!