
Bitcoin is currently adhering to a long-established structural pattern that has influenced past market cycles, maintaining a bullish outlook as long as this trend persists.
The leading cryptocurrency by market capitalization has seen a decline of 44% from its peak of $126,200 in October. This downturn has had repercussions throughout the wider market. Nevertheless, it may be part of an overarching optimistic scenario that could propel $BTC towards unprecedented price levels in the future.
Essential Insights
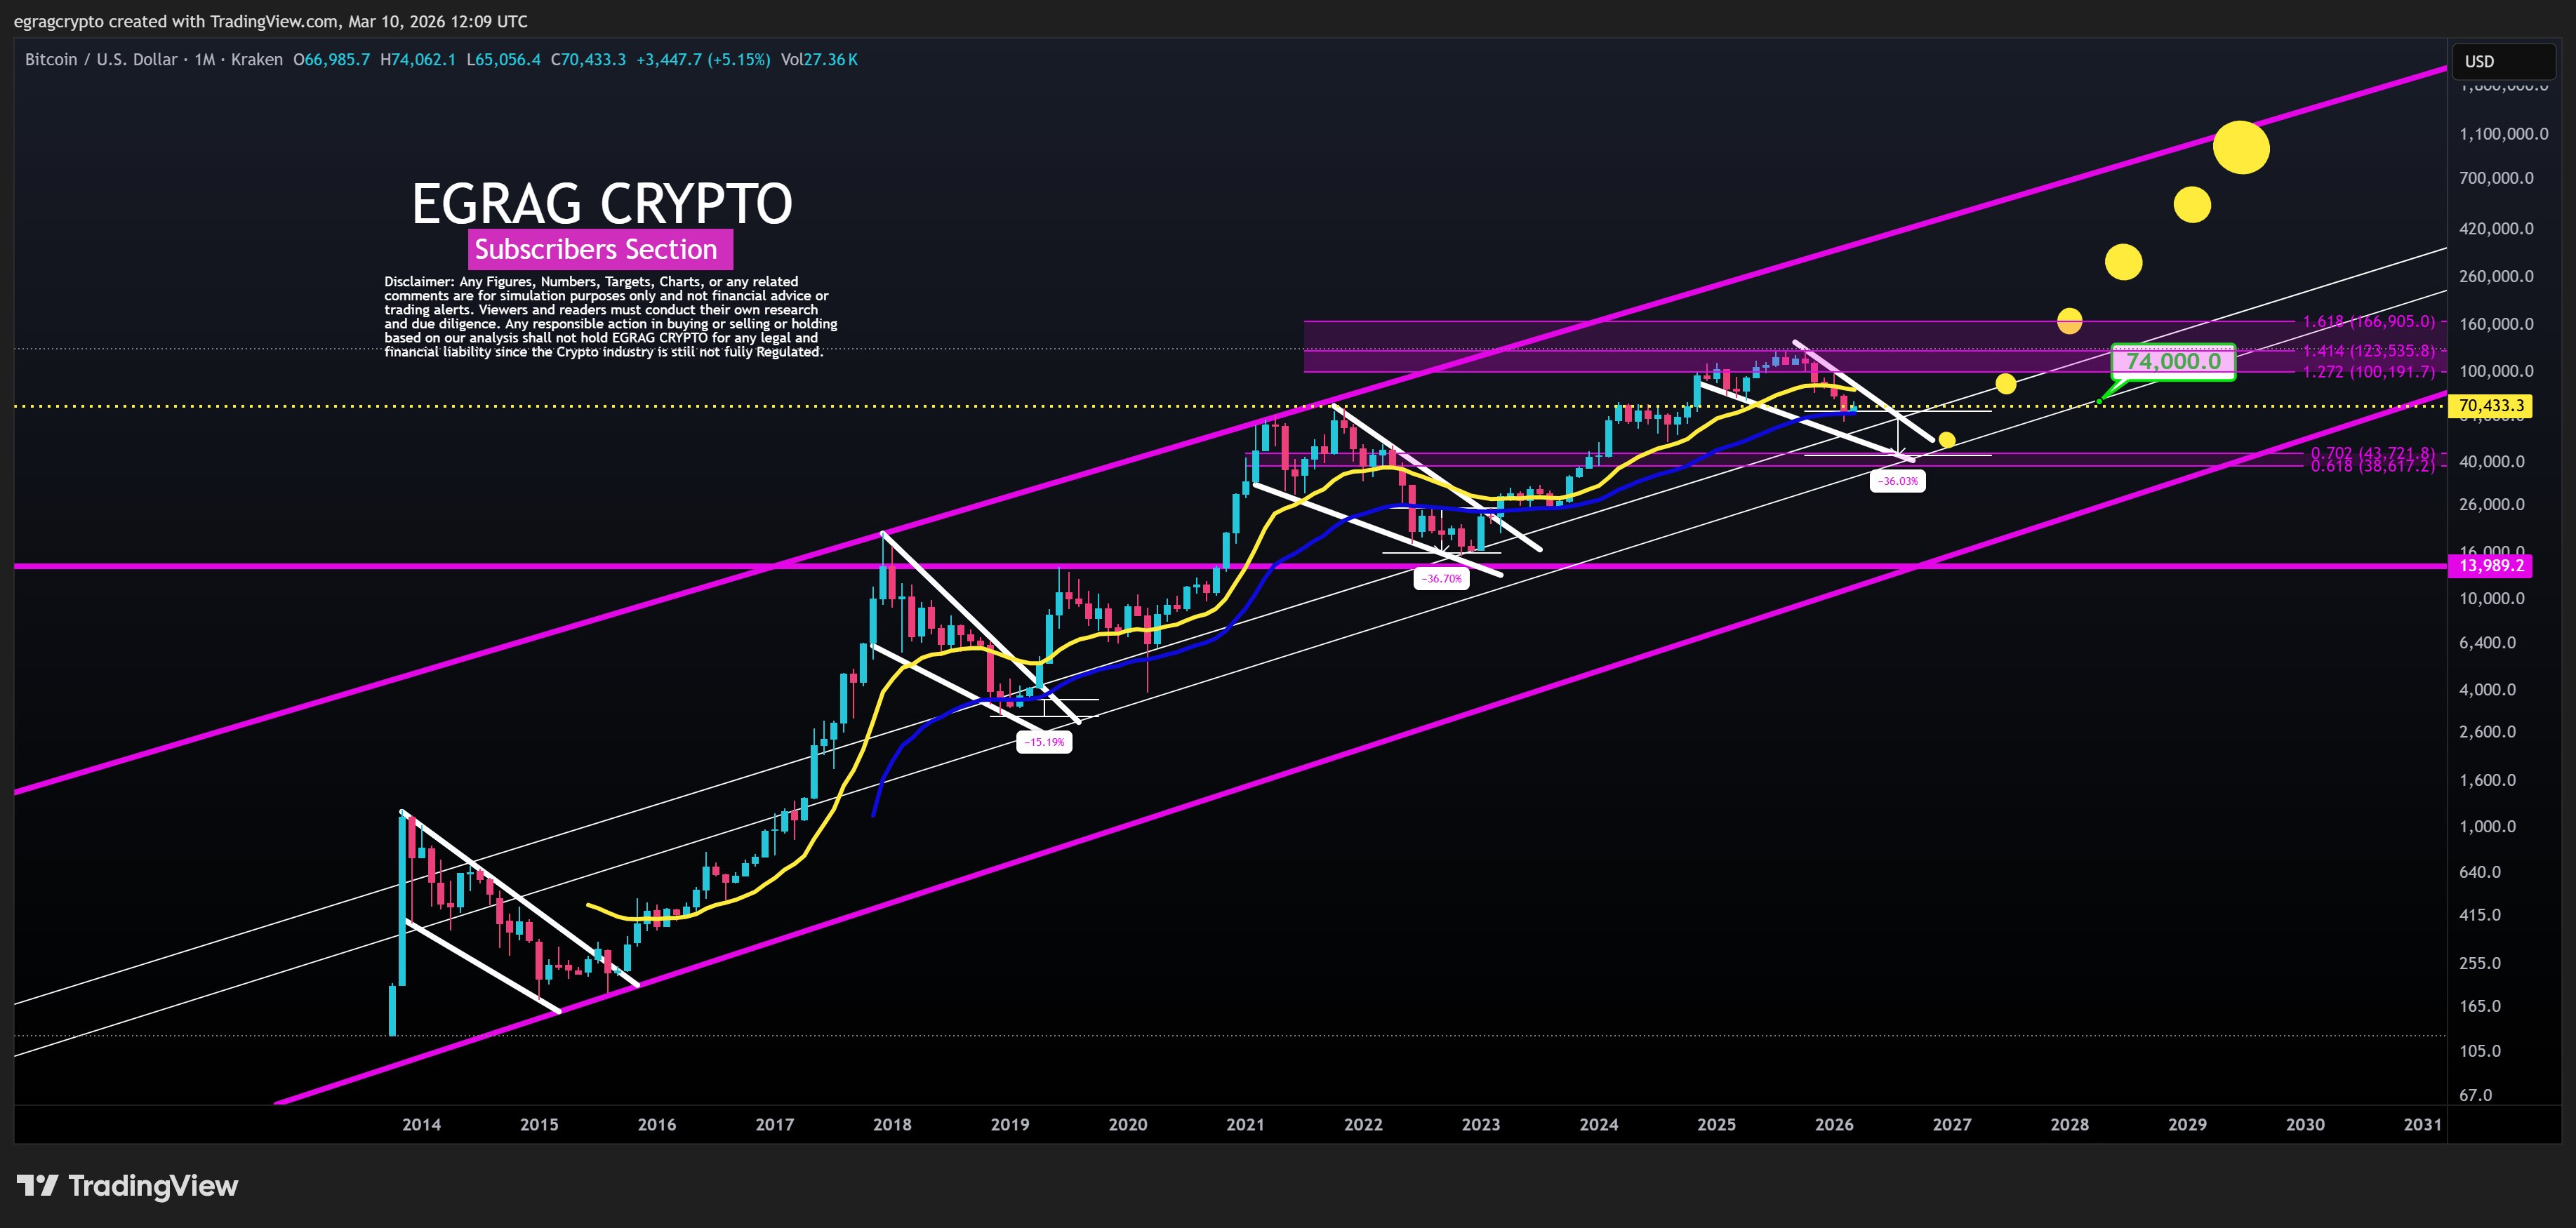
When viewed on a monthly scale, Bitcoin’s price trajectory remains within an expansive ascending channel that has directed its macro movements for several years.
At present, Bitcoin is trading at the midpoint of this enduring structure—a zone historically associated with significant corrections during bullish phases.
Past cycles indicate that declines ranging from approximately 15% to 36% have occurred during robust market periods at this midpoint without signaling the end of the cycle.
If the ascending channel continues to influence price behavior, then a transition to the next phase of the cycle appears likely.
The critical support range between $38,000 and $43,000 is notable; breaching below this level would trigger more severe declines.
Bitcoin’s Position Within Long-Term Ascending Channel
An analysis by market technician EGRAG Crypto emphasized that on a monthly basis, Bitcoin’s pricing still aligns with an extensive ascending channel established over many years.
A supporting chart illustrates that $BTC has been contained within this wedge since 2014. This channel historically serves as both an expansion and correction framework for markets while indicating where major turning points typically occur.
Bitcoin Ascending Channel/EGRAG Crypto
Throughout previous cycles,
Bitcoin
has consistently found support near the lower edge of this channel before initiating new growth phases. Conversely, significant upward trends have often decelerated or reversed when approaching its upper boundary.
Presents suggest Bitcoin trades at mid-levels within this longstanding structure—indicating sustained broader bullish momentum unless it falls below the lower boundary.
Cyclical Corrections are Historical Norms
The overarching trend across four distinct cycles remains upward; however, Bitcoin has regularly encountered sharp corrections even amid bull markets. These pullbacks frequently happen while maintaining an overall positive long-term structure.
Historical data reveals declines between roughly 15% and 36%, occurring during vigorous market phases without marking cycle conclusions. For instance, in 2017, Bitcoin saw a correction around 15%, while 2021 saw a decline of approximately 36%. A similar adjustment might take place in current conditions.
EGRAG views these substantial mid-cycle corrections not as immediate signals indicating impending tops but rather integral components of longstanding patterns in crypto markets.
Long-Term Price Targets for Bitcoin & Bullish Thresholds
&Nbsp ;
&Nbsp ;
&Nbs p ;If continuing adherence to its ascending channel persists,B itcoin’s path toward subsequent stages appears secure . Under such circumstances ,the next key uptrend targets align with psychological thresholds like , coinciding with Fibonacci level &nbs p ;1 .272 .
The following milestones include $123 ,000 followed closely by aspirations reaching beyond previous highs toward approximately $167 ,000 – corresponding directly respectively along Fibonacci extensions identified earlier .&N bsp ;Meanwhile! The essential support area noted lies firmly entrenched between values approximating -. Breaching beneath would apply intense pressure onto prices forcing them downwards potentially targeting regions closer towards boundaries around just under twelve thousand dollars (approx.) !Egrag further outlines two potential trajectories available moving forward regarding BTC’s future prospects : One pathway suggests holding existing supports ultimately culminating rebounds targeting higher goals ($74k) eventually pushing through ceilings upwards again surpassing prior benchmarks previously set ($100k) followed finally hitting those desired objectives surrounding yet another round out-reaching numbers nearing possibly exceeding our current record highs witnessed thus far… Alternatively? A deeper corrective phase may revisit those same supports mentioned earlier before embarking once again into fresh territories filled only brightened opportunities ahead !