
Bitcoin Price Analysis: The $70,000 Battleground
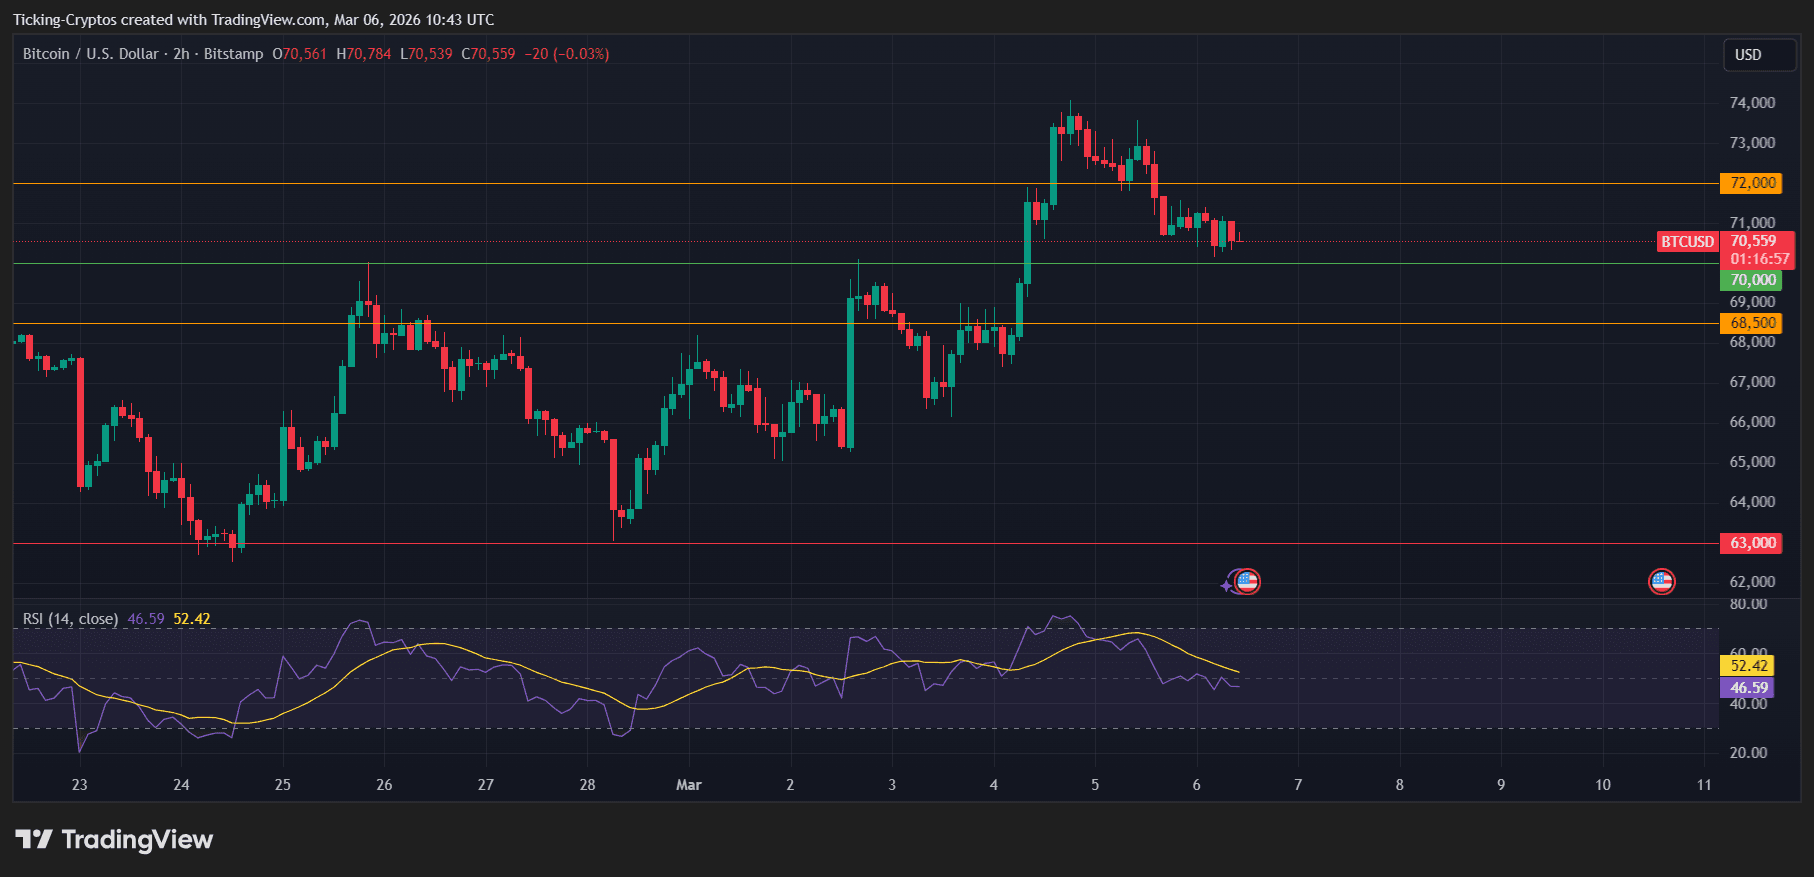
The price of Bitcoin is currently caught in a wave of heightened volatility, hovering around $70,559 on March 6, 2026. After a sharp surge earlier this week that pushed the leading cryptocurrency up to roughly $74,500, the market has entered a cooling phase. This pull‑back is mainly the result of profit‑taking at key psychological thresholds and evolving macro‑economic conditions.
Why Is Bitcoin Falling Today?
The main driver behind today’s downward pressure appears to be a shift in institutional sentiment. Following three days of strong inflows, spot Bitcoin ETFs recorded a net outflow exceeding $227 million on Thursday. This suggests that large‑scale investors are trimming exposure as geopolitical tensions in the Middle East—particularly those involving Iran—continue to simmer, casting doubt on “risk‑on” assets.
Technical Outlook: Key Levels to Watch
From a technical standpoint, Bitcoin’s chart highlights several crucial zones:
Immediate support sits at the psychological $70,000 level. A sustained close below this mark could open a path toward horizontal support near $68,500.
Major resistance lies in the range between $72,000 and $74,000, representing the primary hurdle for bullish traders.
The Relative Strength Index (RSI) on the two‑hour chart hovers around 46, indicating neutral‑to‑bearish momentum as the market searches for a floor.
BTC Coin Analysis: Market Sentiment and Macro Factors
While short‑term price action remains choppy, broader crypto headlines continue to focus on the market’s long‑term resilience. Recent reports from S&P Global note that Bitcoin’s volatility has been trending downward over time as it becomes more integrated with traditional financial systems. In the near term, however, it stays highly sensitive to movements in the U.S. Dollar Index (DXY) and expectations surrounding interest rates.
“Bitcoin is increasingly functioning as a hedge against long‑term currency debasement, yet it still behaves like a high‑beta risk asset during sudden geopolitical shocks.” — Market Analyst Insight.
ETF Dynamics and Institutional Flow
The influence of spot ETFs cannot be overstated. With BlackRock’s IBIT maintaining a dominant market share, daily flow data has become the most watched metric among short‑term traders. The recent swing to negative outflows has sparked concerns about a potential “dead‑cat bounce,” while others view it as a healthy consolidation after a 20% rally from February lows.
What’s Next for Bitcoin?
Investors should monitor the $70,000 threshold closely. If Bitcoin can hold this level through the weekend, it may set the stage for another push toward the all‑time‑high territory around $75,000. Conversely, if higher‑for‑longer interest‑rate narratives gain traction following upcoming employment data, a deeper retest of the $63,000 baseline could unfold.