
Bitcoin’s recent surge past the $70,000 mark has sparked discussions about whether this signifies the beginning of a new upward trend or if it is merely a pause in an extended bottoming phase.
Crypto analyst CrypFlow shared insights on X, presenting a technical argument suggesting that Bitcoin might be at the initial stages of establishing a significant cycle bottom. He believes that October 2026 could serve as the catalyst for another substantial bull market. This analysis draws from long-term trendlines, cyclical patterns, and the Stochastic RSI indicator.
Bitcoin Adheres to Trendline Established Since 2018
A close examination of Bitcoin’s monthly price movements reveals that it continues to follow a multi-year trendline which has historically defined its most significant cycle lows. This ascending line connects the low points from 2018 and 2022 and seems to be providing support once again in 2026. Currently, Bitcoin’s price is positioned right along this crucial structure.
CrypFlow also highlighted an important horizontal zone that previously functioned as resistance during the peak of the 2021 cycle. The former barrier around $69,000 is now being tested as support in today’s market conditions. Such role reversals are critical for Bitcoin’s trajectory since they indicate potential stabilization at this intersection between old resistance levels and rising trendlines.
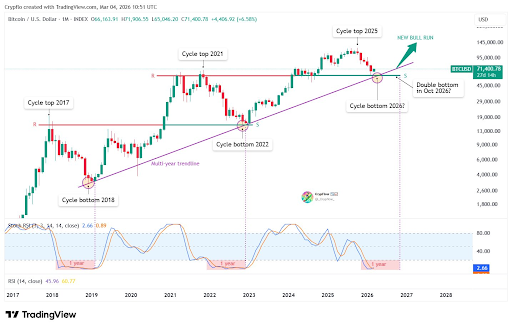
If Bitcoin can maintain its position above approximately $69,000 without dropping into the $50,000 range, it would echo patterns observed during the bottom formation in 2022. That previous low emerged at a similar junction where both an ascending trendline met prior resistance established by peaks from earlier cycles in 2017.
Forecasting A New Bull Market
While price levels often dominate discussions surrounding cryptocurrencies, time tends to receive far less attention—an oversight noted by CrypFlow who argues that many are misjudging this current cycle due to neglecting temporal factors. He pointed out how long each major bear market has seen Stochastic RSI values remain below zero; historical data shows remarkable consistency here.
During both cycles of bear markets spanning from late-2018 into early-2019 and then again through late-2022 into early-2023, Stochastic RSI lingered beneath zero for about one year before genuine recoveries commenced for Bitcoin prices. In contrast, during this current downturn phase so far only around four months have elapsed with Stochastic RSI readings under zero.
This scenario suggests there may be potential for Bitcoin to establish a double bottom later within this year—likely around October 2026—before embarking on another notable bull run begins anew. However, it’s essential to note that such projections do not imply an imminent crash; rather they indicate according to CrypFlow that further consolidation work remains necessary before achieving true cycle bottoms are realized fully.
Featured image from Pngtree; chart sourced from Tradingview.com