
Bitcoin’s market trends have frequently adhered to identifiable technical frameworks, and one analyst suggests that these recurring patterns might already indicate the next significant low.
This concept is rooted in the idea that trading an asset over time reveals a sort of pattern memory. Currently, this memory seems to be signaling a potential Bitcoin price drop below $40,000.
Understanding Pattern Memory and Bitcoin’s Historical Retracements
A chart presented by market analyst Lisa N Edwards illustrates how Bitcoin’s retracement tendencies could influence where the current cycle ultimately finds stability during this downturn. This analysis hinges on the notion of pattern memory—the belief that assets with extensive trading histories tend to exhibit certain behavioral trends across different cycles.
The evidence of pattern memory indicates that previous Bitcoin market cycles have consistently concluded near specific Fibonacci retracement levels from prior peaks. These levels have historically served as points where Bitcoin prices found lasting support before initiating new bullish phases.
In the 2013 cycle, for instance, Bitcoin established its bottom close to the 0.86 Fibonacci retracement level. The subsequent cycle in 2017 mirrored this structure by also reaching a low at the 0.86 retracement before entering another accumulation phase. Conversely, during the 2021 market cycle, the bottom was slightly higher at around the 0.786 retracement level.
Bitcoin Price Chart Source: @LisaNEdwards On X
Analyzing Pattern Memory: Where Might We Find The Next Bottom?
If October 2025 marked an actual peak for Bitcoin—as suggested by monthly charts on a one-month timeframe—then historical data provides insights into potential price movements leading up to another major bull run. By applying similar Fibonacci retracement principles to our current market conditions, we can identify possible zones where Bitcoin may find its next bottom if past behaviors repeat themselves.
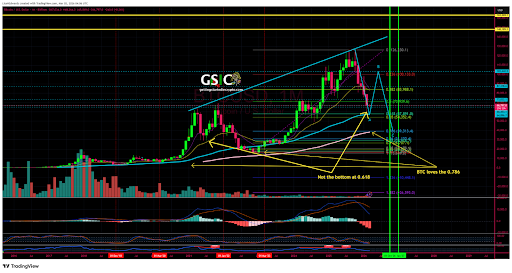
An examination of this current cycle’s Fibonacci levels from its lowest point up to October 2025 high highlights three significant areas of interest. The first is around $57,000-$58,000 at approximately the 0.618 level which closely aligns with weekly moving averages; however, it may not signify an ultimate low based on historical behavior patterns observed in previous cycles.
Instead, deeper corrections appear more aligned with past trends involving key levels such as those at both .786 and .86 retacements; specifically around $39,000 coinciding with monthly moving averages and down further towards about $31,000 for .86 retacements.
Bearing in mind that both these levels have previously marked substantial bottoms within earlier cycles suggests that if October’s peak indeed represents true highs then future lows could fall somewhere between $39k-$31k range moving forward from here onwards!
Certain analysts propose even lower targets predicting revisits towards regions near $20k; yet according pattern-memory assessments such drastic declines would indicate complete deviation away from established cyclical behaviors seen historically throughout Bitcoins journey thus far!
Featured image created using Dall.E; chart sourced via Tradingview.com