
The price of Bitcoin hovers around $68,000 as short-term investors exhibit caution amidst rising tensions between the U.S. and Iran.
Overview
Currently, Bitcoin is trading close to its weekly high within a range of $62,900 to $69,300. Despite the geopolitical unrest, inflows from short-term holders into exchanges remain low. A daily closing price above $70,000 could indicate a shift in momentum for these investors.
As of now, Bitcoin ($BTC) is valued at $68,308—a 1.3% increase over the last 24 hours. The cryptocurrency has rebounded from an earlier decline this week and is positioned near the upper limit of its seven-day trading range between $62,905 and $69,340.
However, the broader trend remains corrective; since hitting an all-time high of $126,080 in October 2025, Bitcoin has seen a significant drop of approximately 45%. In 2026 alone so far it has declined about 20%, reflecting ongoing pressure following last year’s surge.
In recent days there has been an uptick in derivatives activity. According to CoinGlass data analytics reports show that trading volume increased by 8.7%, reaching approximately $72.3 billion while open interest rose by about 1.6% to hit around $44.9 billion—indicating that new positions are likely being established rather than liquidated when both metrics rise together.
Caution Among Short-Term Holders
A March analysis conducted by a contributor at CryptoQuant examined Bitcoin’s Short-Term Holder Profit & Loss (P&L) metric related to exchanges which tracks whether recent buyers are sending their coins back at either profit or loss levels—this group typically reacts swiftly during fear-driven market events which can heighten volatility levels.
You may also find interesting: Bitcoin remains stable near the mid-$63k mark despite bank losses totaling over $306 billion
The report highlighted that on February 5-6 during a significant market downturn roughly around 89K BTC were transferred to exchanges at losses within just one day—a clear sign indicating capitulation among newer market participants; however since then such loss-induced inflows have gradually diminished.
The latest geopolitical tensions involving Iran and the U.S served as another stress test for investors; although Bitcoin briefly dipped towards ranges between $63K-$64K no notable spike occurred in exchange inflows from short-term holders indicating no mass panic selling or aggressive profit-taking emerged from this typically reactive demographic.
This change is quite significant as markets often stabilize once forced sellers exit—the current indicators suggest much liquidation pressure may have already subsided recently leading us into calmer waters ahead with less activity observed among weaker hands among sellers moving forward regarding future trends..
Technical Analysis on Bitcoin Pricing Trends
Selling activity amongst recent buyers appears subdued while if exchange inflow rates continue remaining low it could signal seller fatigue becoming evident should realized losses sharply increase thereby suggesting renewed stress amongst traders involved here moving forward .
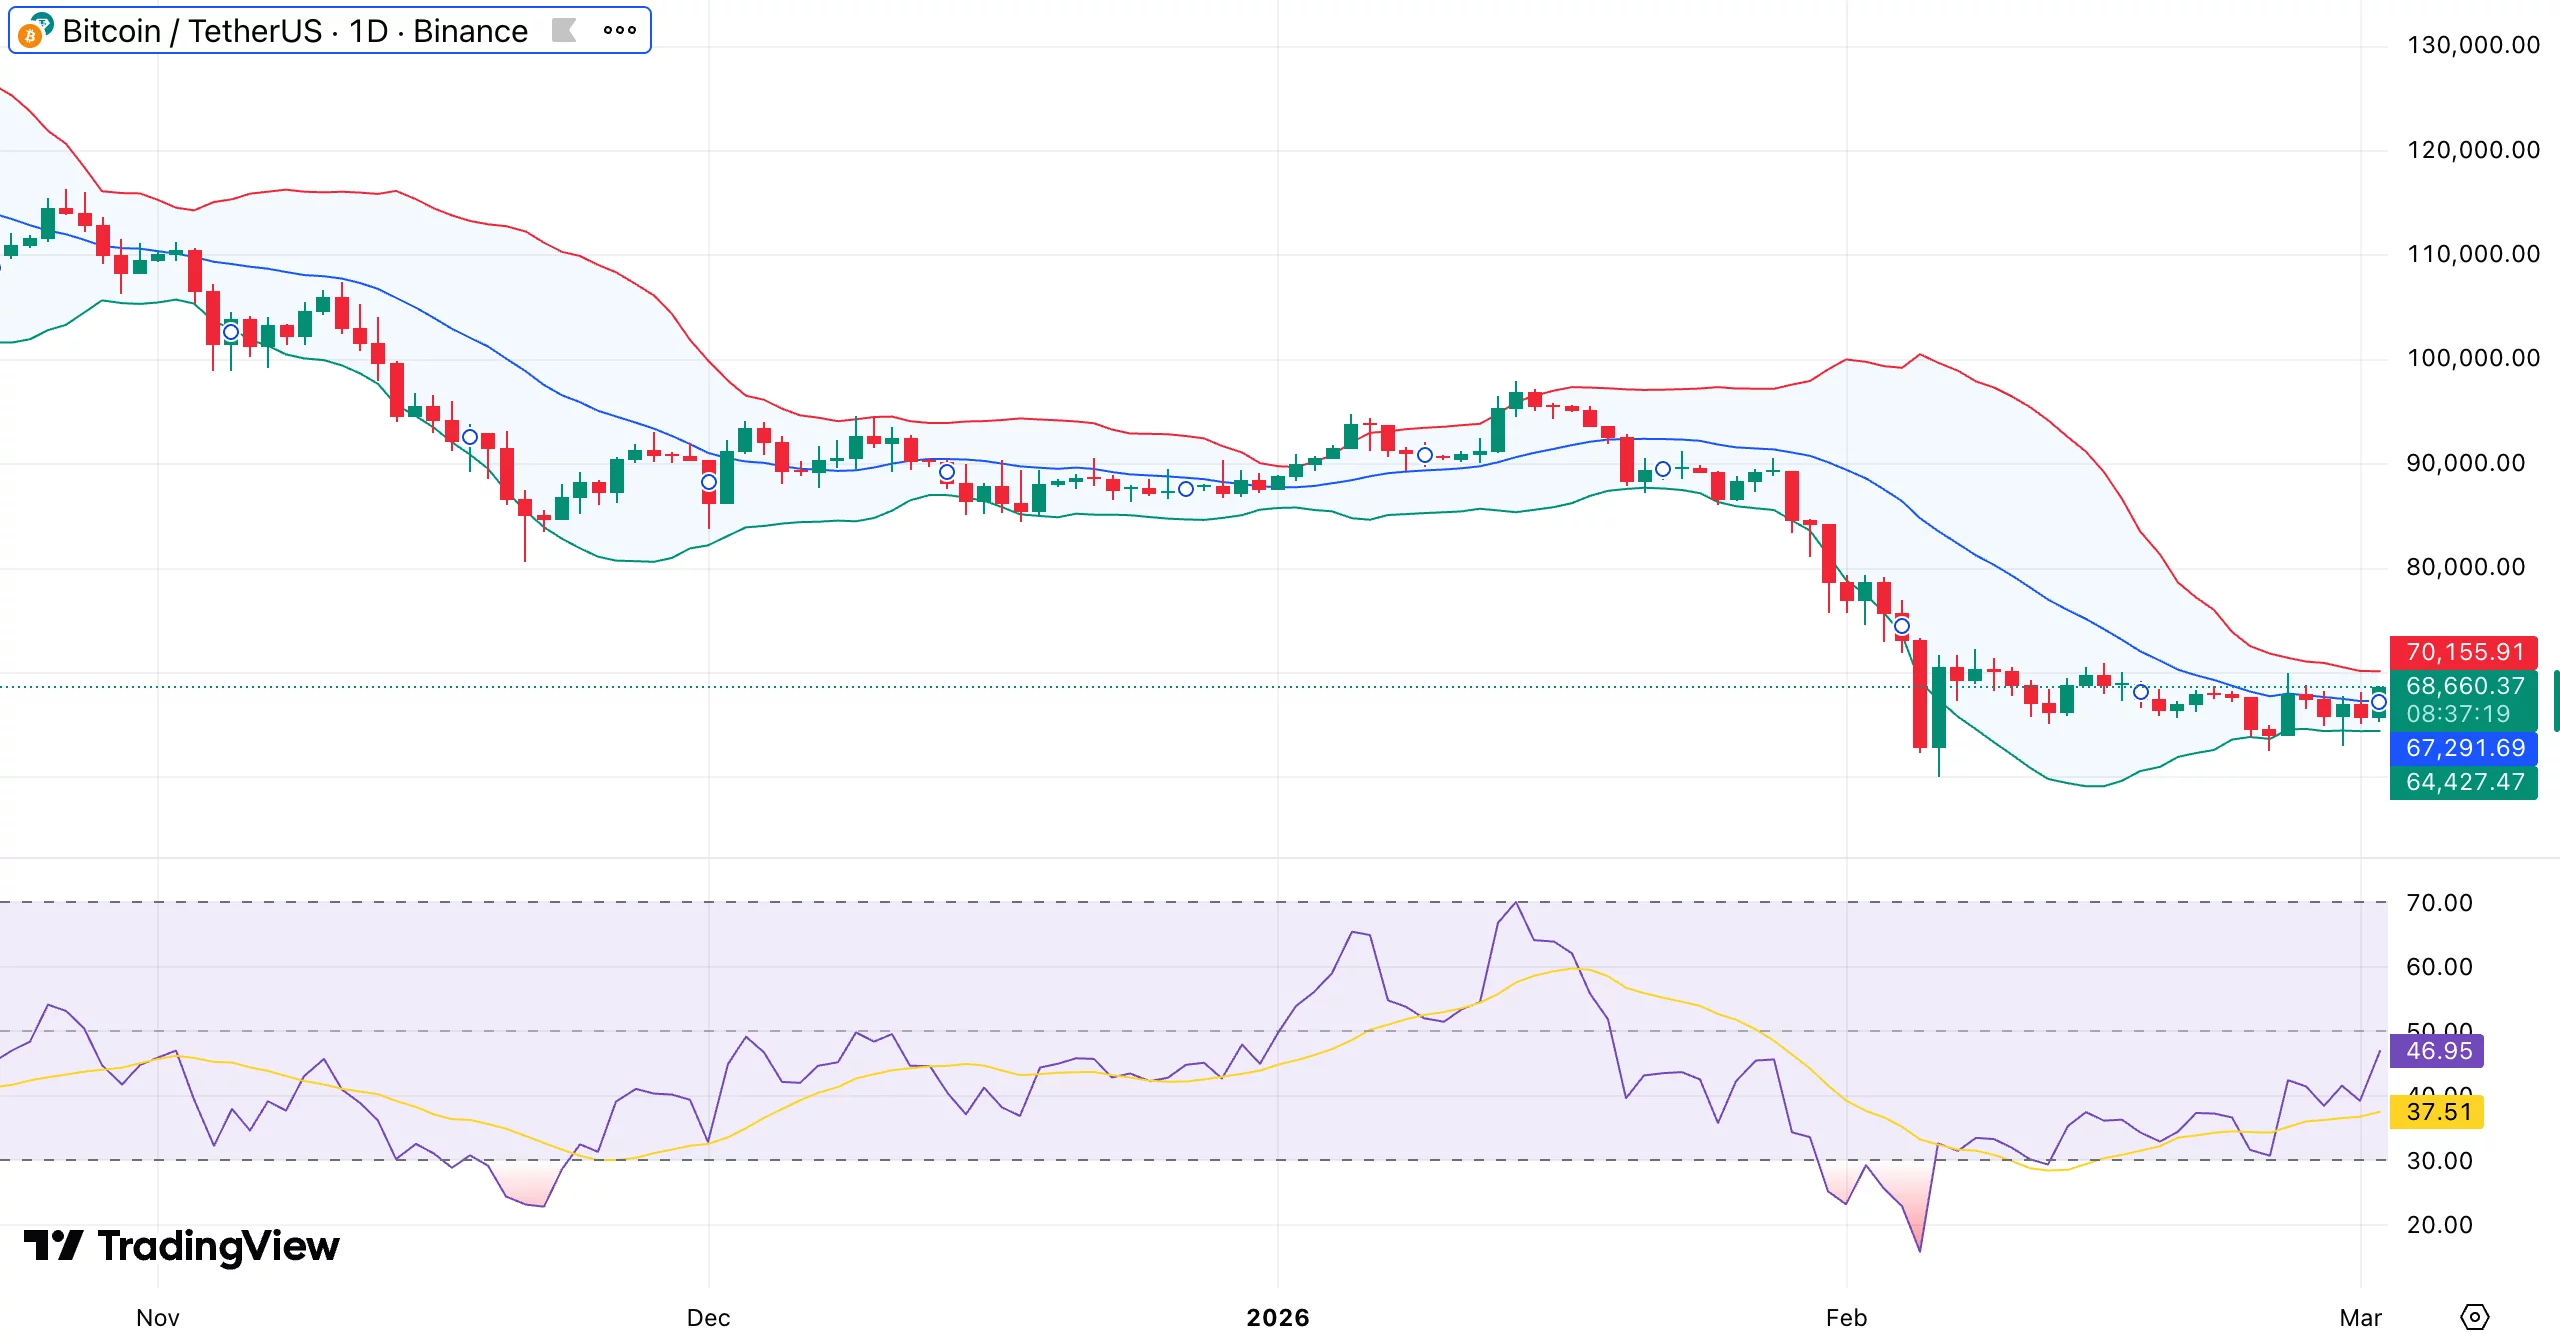
Bollinger Bands indicate prior touching down onto lower band level around $64k before rising back up towards middle band level currently sitting just below $67k with immediate resistance looming nearby upper boundary hovering close towards $70k mark where any rejection occurring within zones spanning$70-71k would maintain upward pressures otherwise strong daily closes surpassing these areas might signify shifts happening soon regarding momentum shifts overall.
The relative strength index (RSI) indicates improvement climbing upwards off oversold conditions previously seen below levels nearing twenty up until present standing closer now approaching forty-seven though still not crossing above fifty representing stronger buyer control territory yet.
This structure seems reflective sharp impulse declines followed subsequently sideways compressions potentially developing bear flags if patterns resolve downward bringing returns back down possibly revisiting lows situated somewhere along sixty-thousands psychological barriers marking support zones located firmly resting anywhere amidst sixty-four thousand through sixty-five thousand regions failing those supports opens doors toward next psychological threshold focusing nearer upon sixties thousand boundaries overall.
Please read more: Bitcoin records third-worst Q1 performance since year ’13 posting negative returns amounting -23%.