An essential long-term technical indicator continues to signal a bullish trend as Bitcoin nears a crucial level on the higher timeframe charts. CMT-certified analyst Tony Severino notes that the monthly SuperTrend indicator for BTCUSD has maintained its support and has yet to issue an active sell signal, despite recent market fluctuations raising questions about whether the cycle has turned bearish. His analysis reveals an intriguing development on the one-month chart, where no confirmed sell transition has occurred.
Monthly SuperTrend Remains in Buy Mode
In his update on X, Severino highlighted the 1M Bitcoin BTCUSD chart and pointed out that the SuperTrend indicator remains supportive with an active buy signal intact. The significance of this monthly timeframe lies in its ability to filter out short-term volatility and provide a clearer perspective on broader market cycles.
The accompanying chart illustrates Bitcoin trading around $66,300, with the SuperTrend level positioned just above $66,400. Notably, this indicator continues to show green on a monthly basis, indicating that macro trends have not shifted into bearish territory. A confirmed sell signal would require a monthly close below the SuperTrend line—a scenario that hasn’t materialized yet.
The visual representation in the chart also indicates how previous bear markets were marked by distinct transitions from green to red within the SuperTrend framework. Currently, such a transition is absent; instead, Bitcoin’s price is consolidating near this key support level.
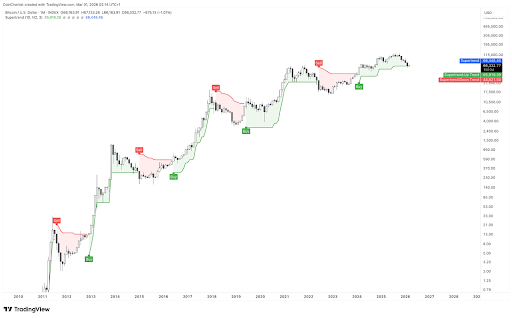
Bitcoin Price Chart Source: @TonySeverinoCMT On X
Is The Bottom Near or Is More Patience Required?
Severino provided an important disclaimer: he observed that nearly all bear markets initially maintain support for one to three months before eventually triggering sell signals. This insight suggests that merely holding at support does not eliminate bearish risks entirely. While he acknowledged that bear markets can hover at support before failing completely, he noted such behavior often indicates proximity to market bottoms.
As of February 14th, Bitcoin was trading 14.8% below its monthly opening but managed to stay above the SuperTrend line. However, should there be any confirmed breakdown beneath this line during any month-end closing session it would significantly alter current outlooks; until then though—the indicator suggests Bitcoin remains within bullish territory.
Lately Severino shared another post discussing further analysis based upon quarterly Ichimoku indicators wherein historical data implies potential declines for Bitcoin ranging between 38% and 66% from present levels—suggesting possible bottom prices anywhere between $40k-$25k if realized fully.
A follow-up comment from him stated “Sell says supertrend.” As of now while writing this piece—Bitcoin trades around $66k down by approximately 1.6% over past twenty-four hours—with no definitive breakage occurring within current structures but warnings indicate cryptocurrency may still face uncertainties ahead!
Featured image created with Dall.E; Chart sourced from Tradingview.com