On March 1, 2026, at 8:30 a.m. EST, Bitcoin was priced at $66,424, fluctuating within an intraday range of $63,886 to $68,043. Despite some short-term stabilization observed on the charts, overall market momentum and moving averages continue to suggest a cautious outlook across various time frames.
Bitcoin Market Analysis
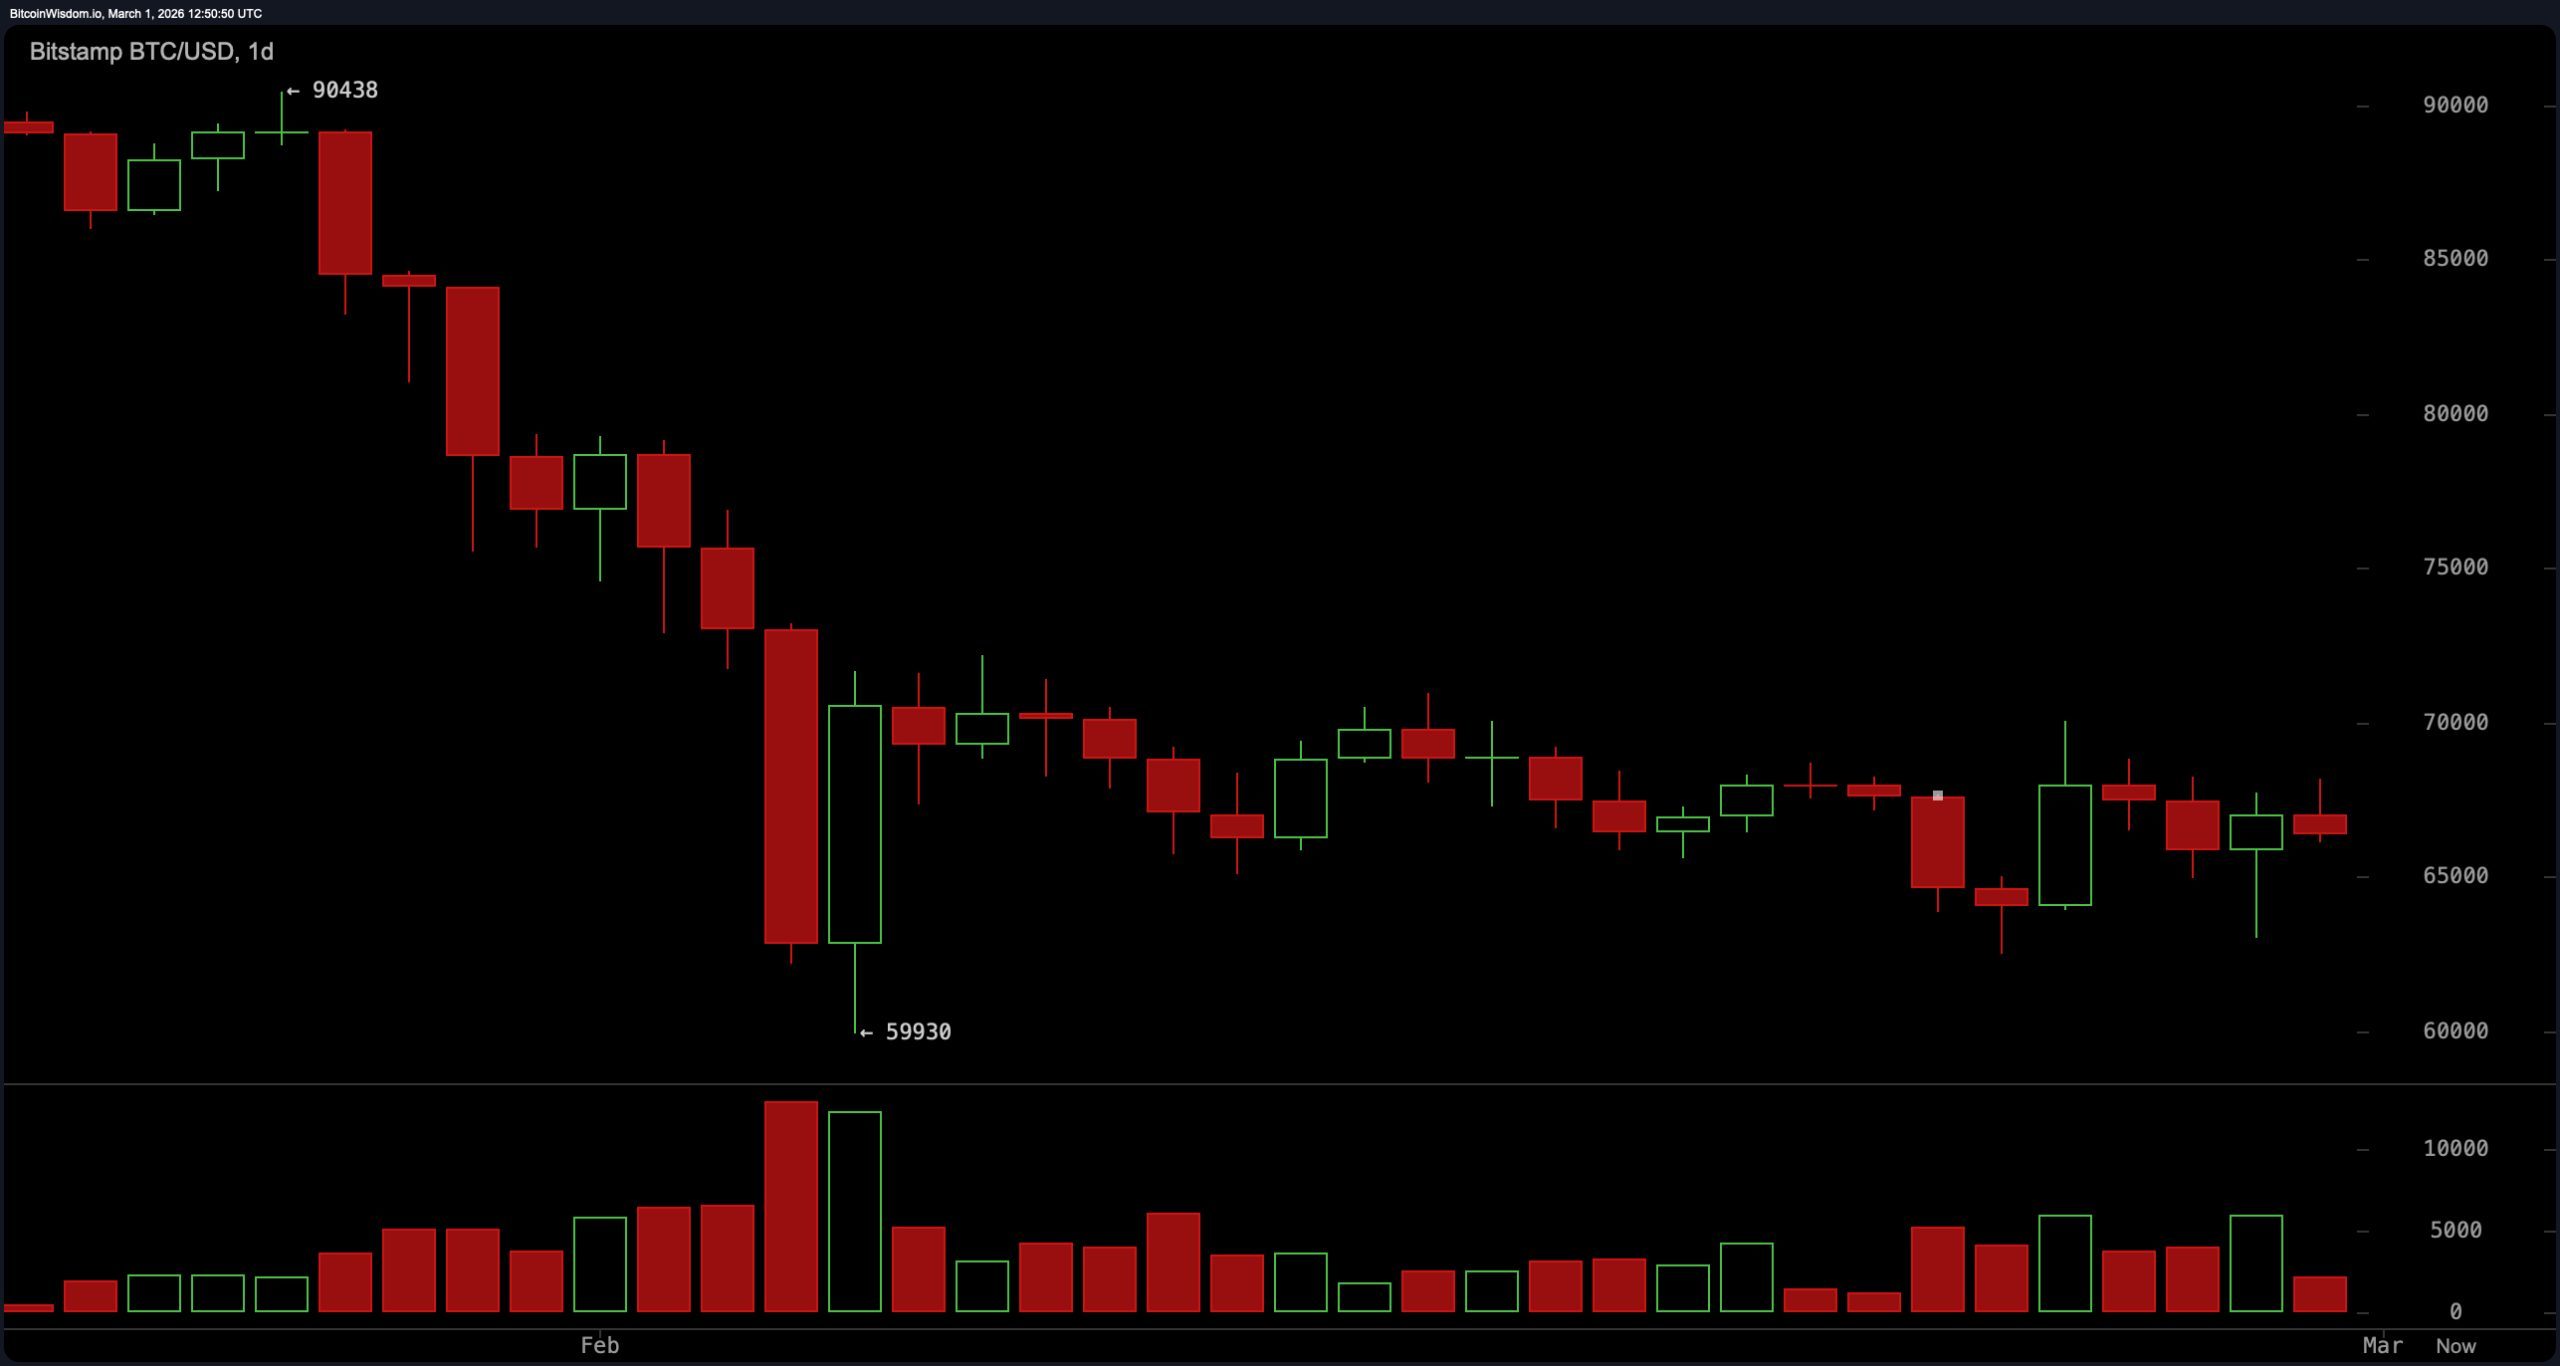
The daily chart reveals that Bitcoin is still entrenched in a bearish macro trend after falling from around $90,000 down to a low near $59,900. Currently, the price is squeezed between support at approximately $63,000 and resistance in the range of $69,500 to $70,000. The formation of lower highs near the upper boundary indicates persistent selling pressure while declining volume during this consolidation phase points toward market compression.
This pattern resembles either a bear flag or distribution zone unless Bitcoin can decisively break above the critical resistance level near $70,000. Until such an event occurs clearly with conviction on higher timeframes like daily and four-hour charts; the dominant trend remains downward despite occasional upward corrections.
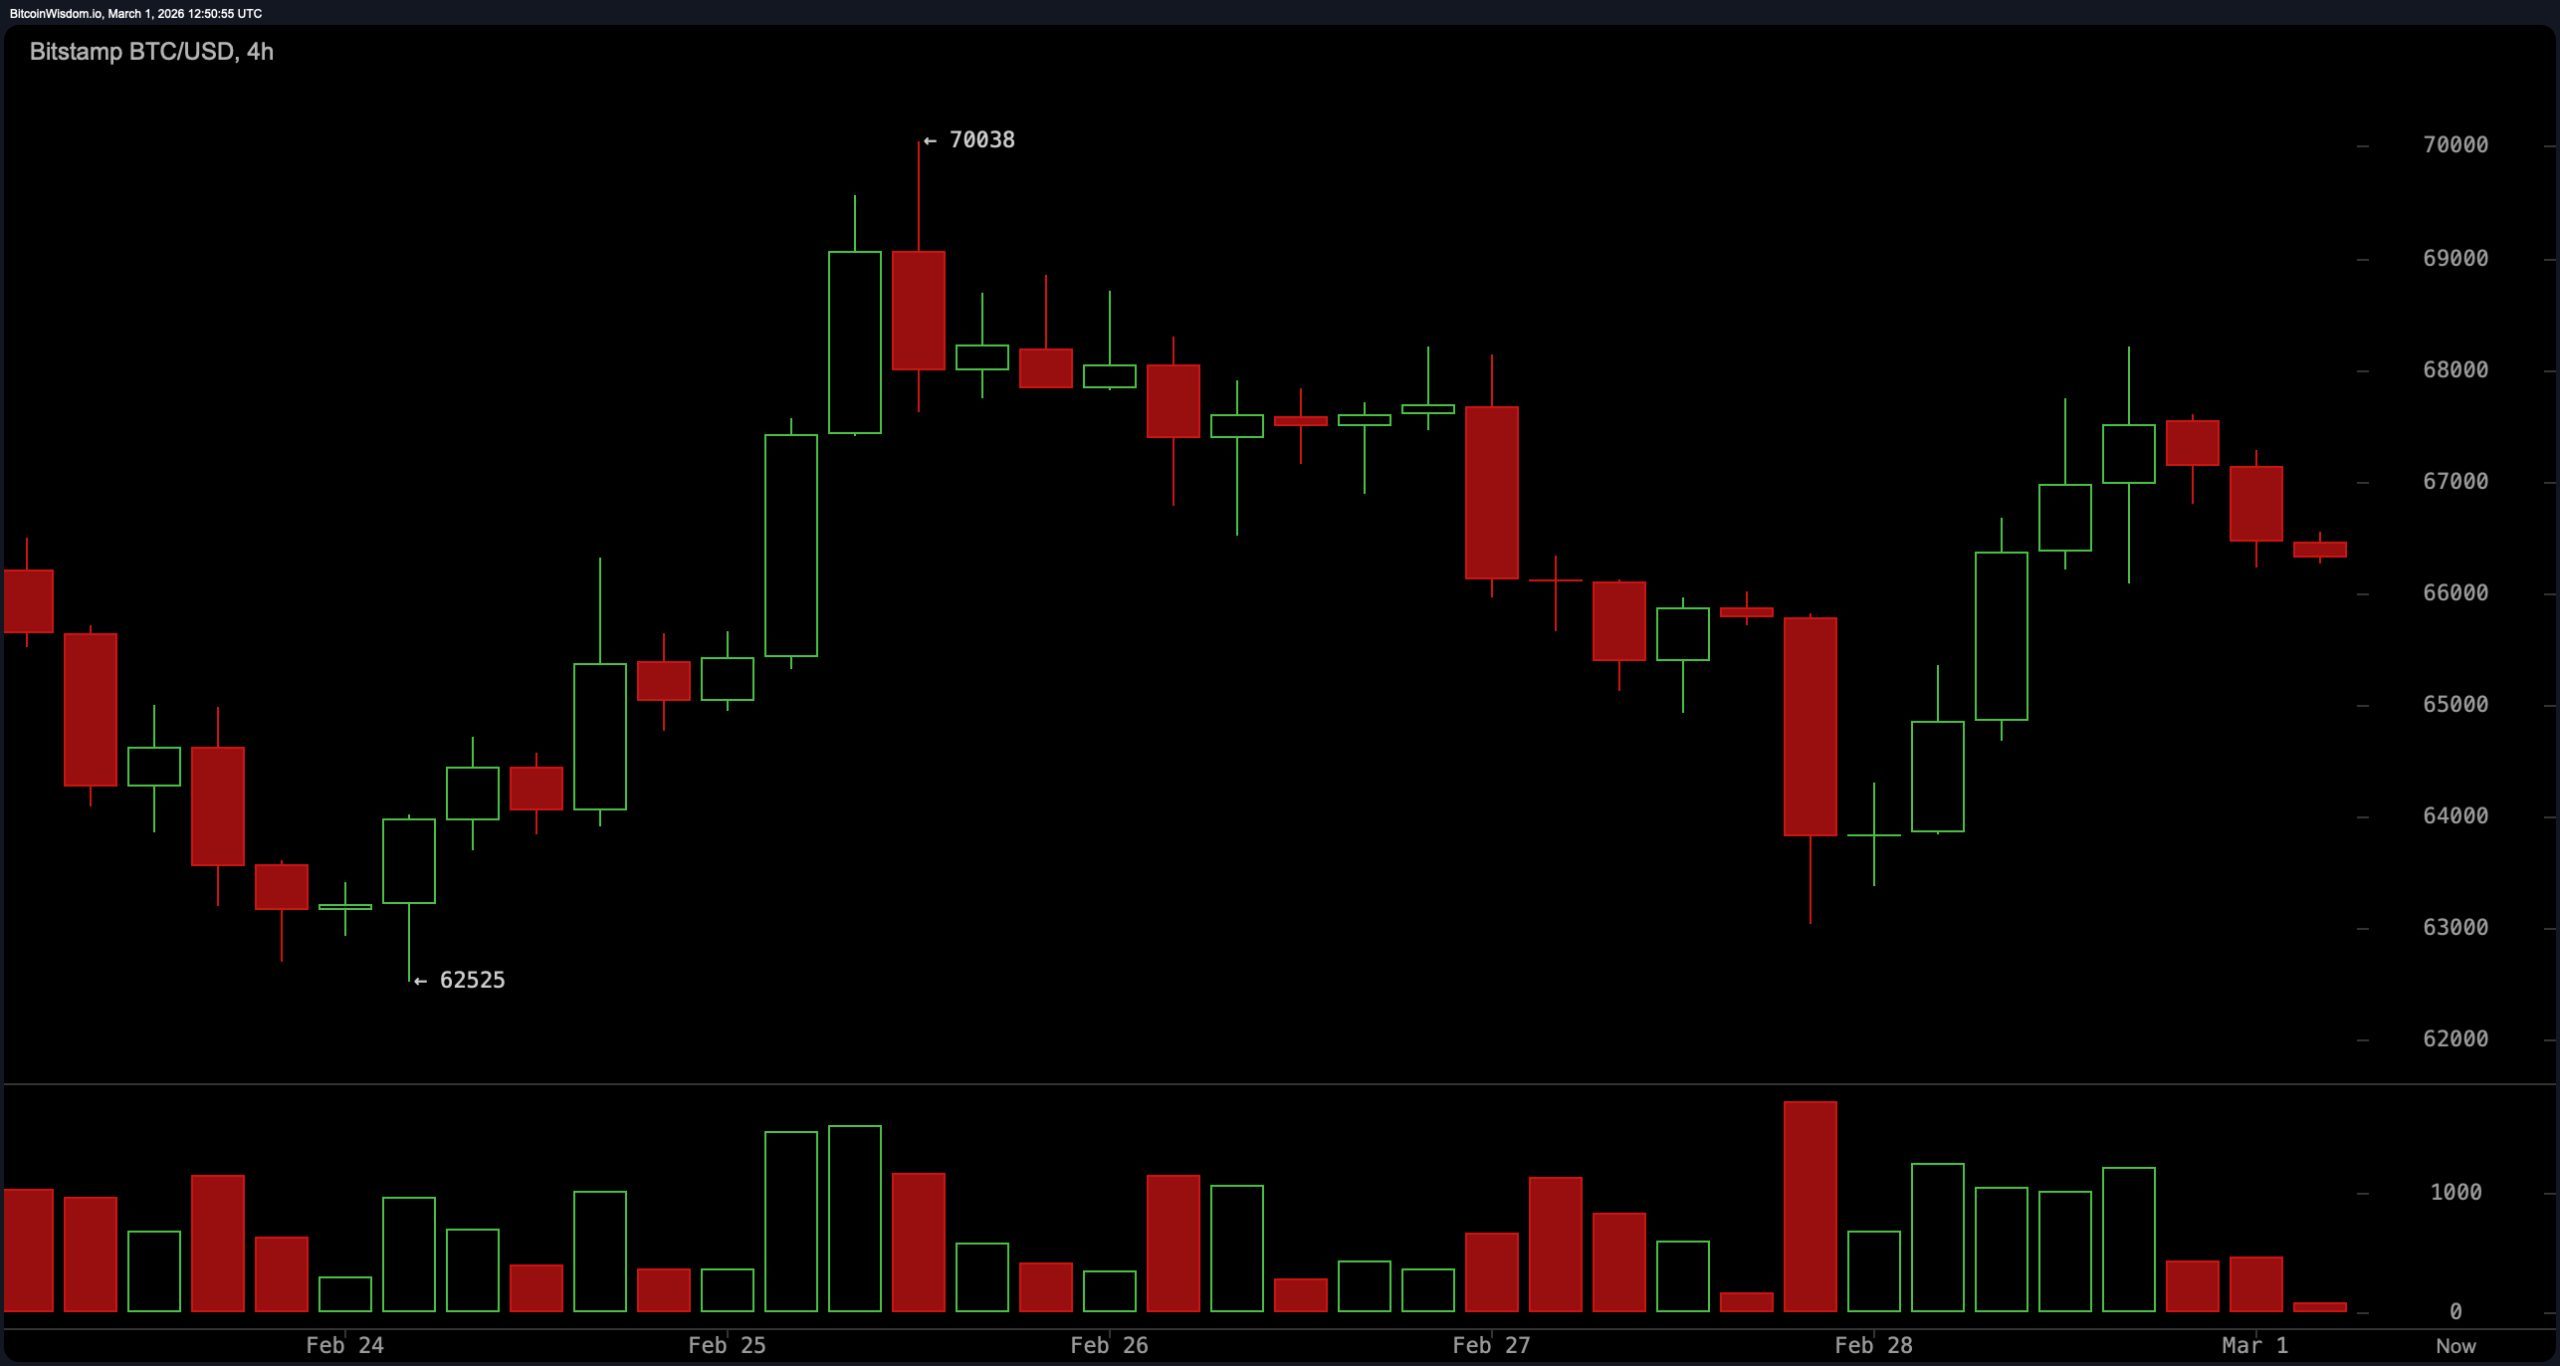
Looking closer at the four-hour timeframe shows that after bouncing off roughly $63K support once again buyers failed to push past resistance close to $70K resulting in another lower high before prices declined anew. The key support zone lies between about $63K-$64K where demand has consistently appeared intraday while sellers dominate between roughly$68K-$70K overhead.
The structural triggers here are clear: dropping below ~$63k would signal further breakdowns whereas reclaiming and holding above ~$68k-$70k would indicate potential bullish momentum returning. Momentum indicators currently lean slightly bearish until these levels are convincingly breached — meaning this trading range remains intact but lacks strong bullish confirmation for now.
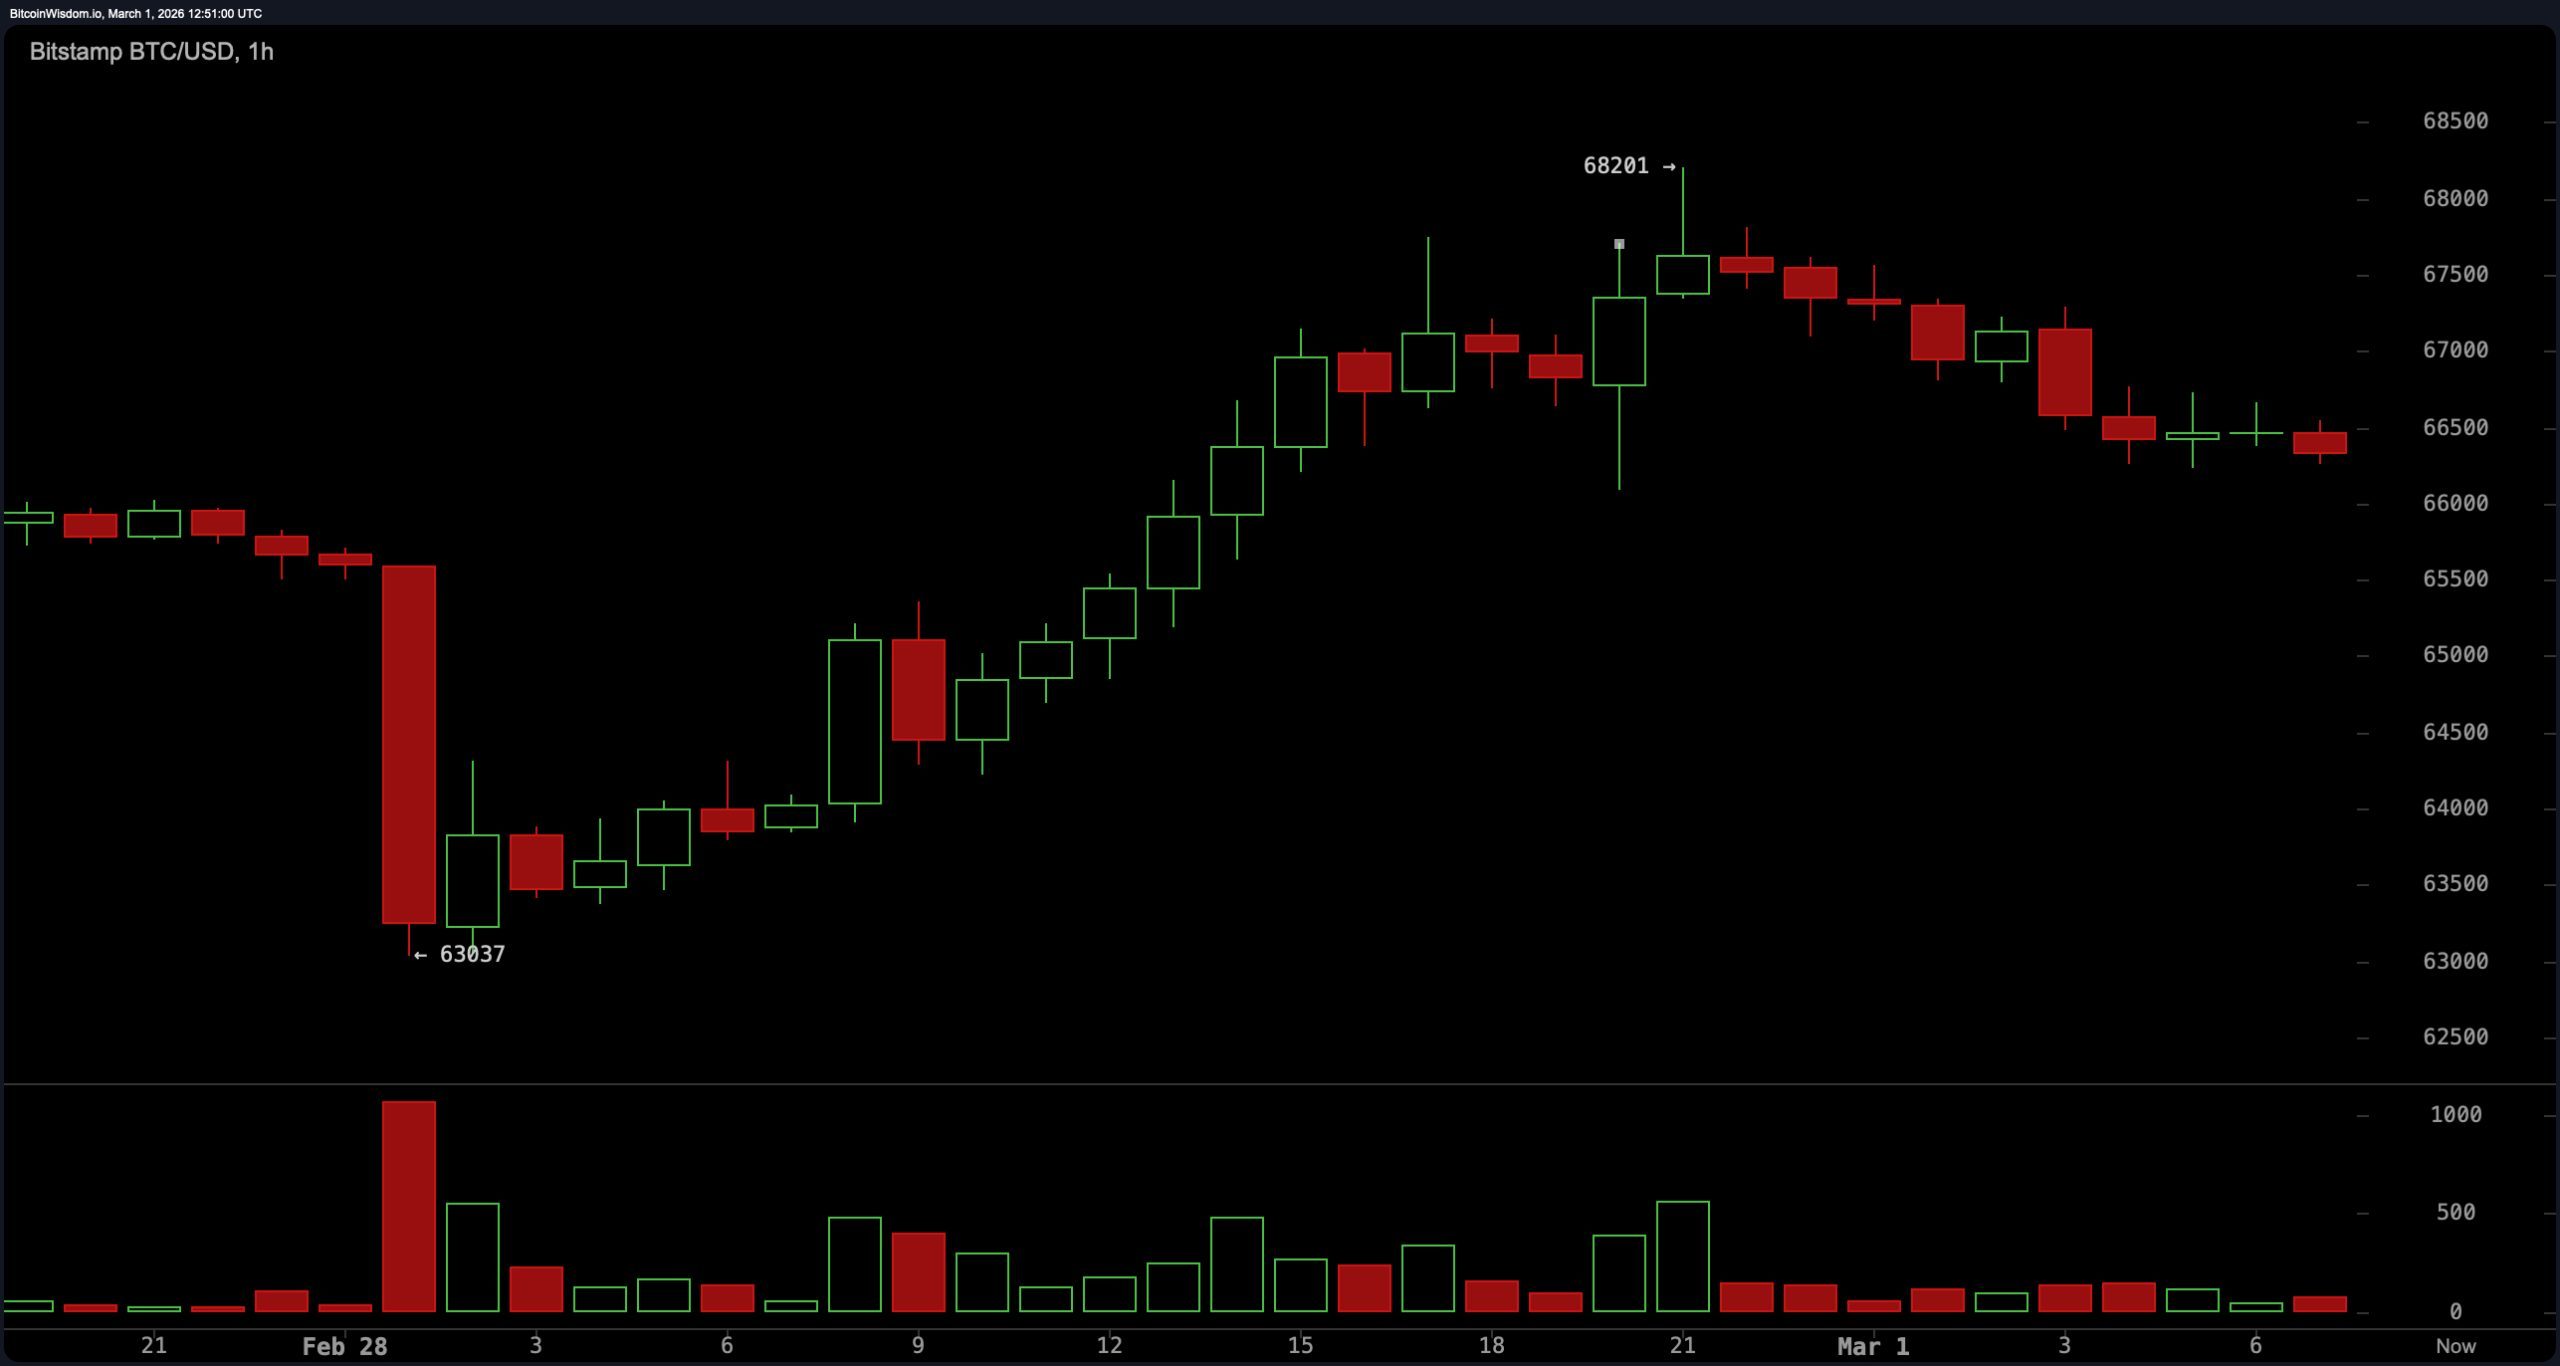
Examining hourly data reveals sharp declines toward the key psychological level of about$63k followed by attempts pushing higher up near$68, 200 before stalling just below$67, 000 as lower highs begin forming again—signaling waning buying strength post breakout attempt.
A close under$63, 000 on this timeframe could confirm renewed downside risk targeting lows around$61, 00 then possibly revisiting prior capitulation lows near59, 900.
Conversely sustained moves above~68,$500–69,$00 might reopen challenges toward breaking through major resistance zones approaching seventy thousand dollars.
The oscillators present mixed signals but generally tilt towards caution—the RSI stands around40 indicating neutral momentum while Stochastic oscillator reads48 also neutral territory.
The Commodity Channel Index (CCI) sits negative29 reinforcing lackluster directional bias whereas Average Directional Index (ADX) measures50 showing strong trend presence without clear directionality.
A notable divergence exists between MACD which suggests upside potential versus raw momentum readings signaling downside pressure—highlighting internal conflict within current price action dynamics.
Moving Averages Perspective
All significant moving averages—from short-term exponential (10-day EMA at ~66,$836) through long-term simple moving averages (200-day SMA nearing97,$085)—remain positioned above current prices confirming ongoing downward pressure across multiple durations.
The inability for Bitcoin’s price to climb back over these key technical levels means bulls must prove their strength by sustaining breaks beyond seventy thousand dollars for any meaningful reversal hopes.
Bullish Scenario:
If Bitcoin manages a decisive breakout closing strongly above seventy thousand dollars accompanied by rising volume on shorter intervals like one hour or four hours it would invalidate recent series of lower highs signaling structural improvement.
This could open pathways targeting subsequent resistances such as72,$00 then potentially75,$00 marking renewed upward trajectories.
Bearish Scenario:
Failure to hold critical supports especially below sixty three thousand confirmed with heavy selling volumes may accelerate declines exposing next floors located approximately61,$00 followed by previous lows sub60,$00 possibly dipping towards56,K if volatility intensifies.
Overall technical structure favors bears unless convincing upside breakthroughs occur first.
Frequently Asked Questions 🔎
What was bitcoin’s value on March 1st?
Bitcoin traded around66,K within daily ranges spanning from nearly64,K up through just over68,K during that session.
Is bitcoin currently trending upwards or downwards?
It remains trapped inside broader bearish formations indicated by trading beneath all major EMAs &sMAs highlighting prevailing weakness despite minor rallies seen intermittently throughout recent weeks/months..
Main areas providing support/resistance?: Immediate floor rests close approx63586 USD mark whilst ceilings hover mainly surrounding6950027000 region defining upper limits traders watch closely..
<&'s next big move hinges upon what triggers?. A confirmed breakout past7000027000 OR breakdown beneath630006400 trigger fresh volatility expansions likely setting new directional biases going forward..>