
Bitcoin has dipped below a modified realized price level associated with newer supply, indicating potential stress among current holders. Traders are eyeing the $72,000 mark as a crucial pivot point that could shift the market from its current range trading into an upward trend.
Bitcoin Drops Below Adjusted Realized Price Amid Rising Geopolitical Tensions
According to insights shared by market analyst That Martini Guy on X, Bitcoin has fallen beneath its adjusted realized price for the first time in this cycle. This metric excludes coins held for over seven years and reflects the average acquisition cost of more recently active supply. Historically, when Bitcoin trades below this threshold, it often indicates that many holders are experiencing unrealized losses.
CryptoQuant’s data reveals that Bitcoin’s market price has slipped under the adjusted realized price line around $72,000. The chart shows that throughout 2023 and most of 2024 and 2025, Bitcoin maintained values above this cost basis. However, recent declines have pushed prices below this critical orange curve on the chart, marking a significant change in market dynamics.
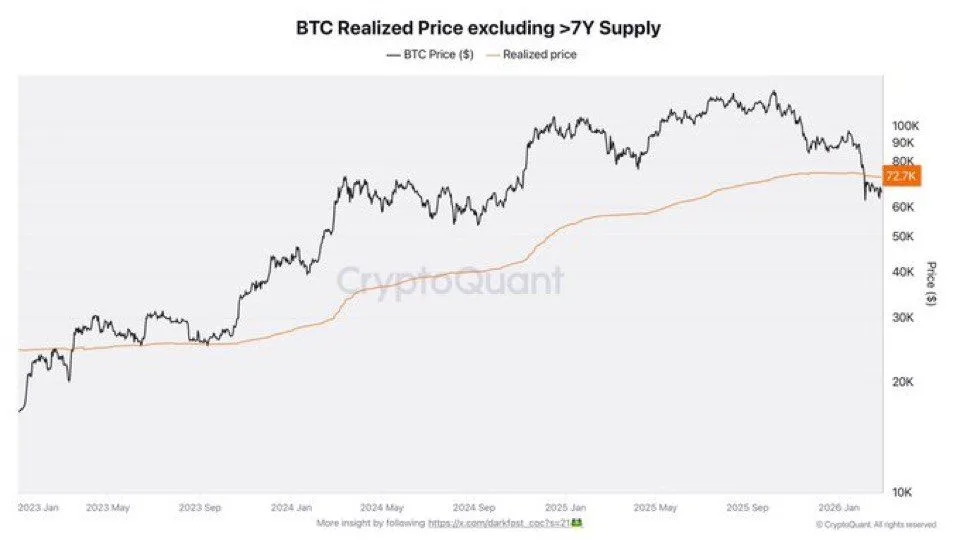
The Adjusted Realized Price of Bitcoin Falls Below Market Value. Source: CryptoQuant
This downturn coincides with escalating geopolitical tensions involving the United States, Israel, and Iran. Recently exchanged warnings between officials from Washington and Tehran followed Israeli military actions linked to Iranian-backed factions. These developments have heightened pressure on global markets as investors react to potential regional escalations; oil prices surged while equities experienced volatility due to uncertainties surrounding possible supply disruptions and military actions.
The increase in tensions led to renewed selling pressure on risk assets like Bitcoin which typically mirrors broader macroeconomic sentiment during stressful periods; consequently it sharply declined from recent peaks. This pullback aligns with rising demand for traditional safe-haven assets such as U.S. dollars and government bonds as traders reassess their positions amid fears of direct confrontations or expanded military involvement.
The adjusted realized price now serves as a benchmark for traders evaluating whether this decline signifies temporary distress or signals a more profound trend shift ahead. Historical patterns indicate that prolonged trading beneath this level can lead to increased volatility while rebounds above it often suggest renewed bullish momentum.
At present moment ,Bitcoin remains below this threshold amidst ongoing geopolitical developments . Financial markets continue monitoring diplomatic communications ,military activities ,and reactions within energy sectors—all factors likely influencing risk appetite moving forward .
Traders Eye $72K Resistance Level As They Anticipate Breakout
Apart from these concerns ,the four-hour chart for Bitcoin on Binance illustrates pricing trapped within an extensive consolidation zone following both steep sell-offs followed by sharp recoveries according analysis provided by Captain Faibik via X platform . His analysis delineates clear boundaries where repeated interactions occur suggesting transition away from trending behavior towards oscillatory patterns instead .
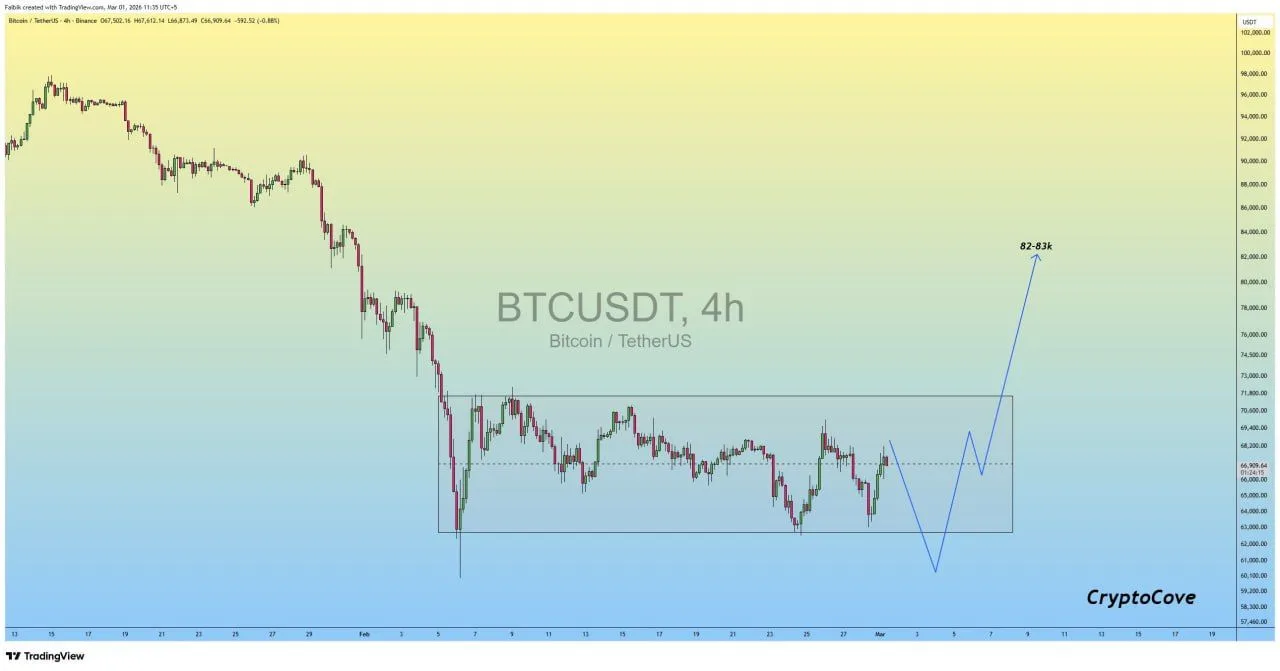
A Four-Hour Range Setup For BTCUSDT Source:Captain Faibik On X
Faibik indicated there could be significant movement forthcoming framing immediate risks around what he termed “bear traps” where prices dip beneath support levels triggering exits before reversing back upwards again later downline.On his charts lower boundary corresponds closely with recent wicks & rapid rebounds indicative aggressive buying interest after breakdown attempts occur..
He also pointed out how crucial reclaiming$72000 would be since past rallies had stalled near upper parts marked range ceiling confirming buyers absorbed supplies at top structure if they manage push cleanly beyond those thresholds.
Should bulls successfully reclaim$72000,Fabik believes we might see bitcoin rally toward zones ranging between$82000-$83000 come March.This projection follows typical sequences observed within ranges whereby confirmed breaks through resistances tend trigger follow-through movements leading traders repositioning defensive setups into momentum-driven trades.