Bitcoin is currently exhibiting its most extreme oversold condition ever recorded, as it continues to face downward pressure amid challenging macroeconomic factors and ongoing outflows from exchange-traded funds (ETFs).
Data from CryptoSlate reveals that Bitcoin’s price fell to approximately $62,700 within the past 24 hours, with its weekly relative strength index (RSI) dropping to about 25.7. However, at the time of writing, Bitcoin has rebounded above $66,000.
Alex Thorn, head of research at Galaxy Digital, highlighted that this weekly RSI level is “lower than any period except during the bleakest bear markets.”
Thorn further explained that since 2016, similarly low RSI readings only occurred in late 2018—when Bitcoin’s price plunged from $6,000 down to $3,000—and mid-2022 during the collapse of crypto lending firms Genesis and Three Arrows Capital.
This scenario has led market analysts to describe the current environment as one of “complete capitulation,” noting that such extreme RSI values have historically been followed by prolonged and turbulent recoveries rather than immediate rebounds.
Capitulation Indicators Signal a Shift but Base Formation May Still Be Underway
The momentum indicators have reached an extreme point; however, Bitcoin’s price movement still seems largely influenced by forced liquidations and portfolio risk reductions. This process involves weaker holders offloading their assets while larger investors accumulate them.
This distinction is crucial because oversold conditions alone do not guarantee a market bottom—they often arise when selling becomes mechanical instead of driven by emotion.
In these circumstances, ongoing liquidations and reduced liquidity can keep prices suppressed even after initial panic subsides.
Supporting this view are Glassnode metrics showing Bitcoin’s 90-day realized profit-and-loss ratio falling below one—a threshold indicating an “excess loss-realization” phase where realized losses dominate trading activity. This suggests sellers remain in control over pricing dynamics.
The analytics firm CryptoQuant describes this period as the deepest pain phase within the current downturn. On-chain data shows investors are experiencing record-high realized losses while active traders absorb significant hits during this cycle. According to CryptoQuant’s analysis:
- Retail investors appear mostly capitulated;
- Larger holders or whales continue accumulating more aggressively;
- This pattern typically emerges in later stages of corrections when base-building begins;
- The situation resembles a correction rather than a full bear market—similar in scale to November 2019 before subsequent upward moves occurred.
A Nuanced Interpretation Beyond Extreme RSI Readings
A record-low RSI signals capitulation may be underway—a necessary precursor for establishing a bottom—but does not confirm that support levels have fully formed yet. Consequently:
- The aftermath often features choppy trading ranges instead of sharp V-shaped recoveries;
- Sellers who remain trapped might offload positions into rallies;
- Bidders demand discounts due to ongoing heavy loss realization;
- This dynamic represents a transition phase moving toward base formation rather than an exact turning point.
An alternative perspective comes from Alphractal’s Sharpe Ratio analysis which evaluates risk-adjusted returns across broader cycles. Their findings suggest:
- Bitcoin is undergoing an advanced repair stage with compressed risk-return profiles compared with last year;
- Investing now implies lower expected returns but also diminished relative risks compared with earlier declines;
- Past periods featuring even lower Sharpe Ratios coincided with major bottoms where long-term asymmetry improved significantly; thus BTC could be nearing such territory though not quite there yet.
Lack Of Institutional Demand & ETF Outflows Amid Thin Liquidity Conditions
A key difference between this pullback and previous ones lies in fading institutional demand channels—particularly via ETFs—which traditionally acted as steady marginal buyers during downturns but now show net capital outflows exceeding $4.5 billion across twelve US spot Bitcoin ETFs since early January according to SoSo Value data spanning five consecutive weeks’ redemptions.
Market depth has deteriorated markedly: Coin Metrics reports average order book depth within ±2% around mid-price dropped drastically—from roughly $40-$50 million between August–October 2025—to just $15-$25 million recently.
Reduced liquidity exacerbates sell-offs causing sharper price drops without fresh negative news catalysts.
Additionally stablecoin supplies (USDT & USDC) stagnate near ~$260 billion implying limited new inflows despite attempts at floor formation.
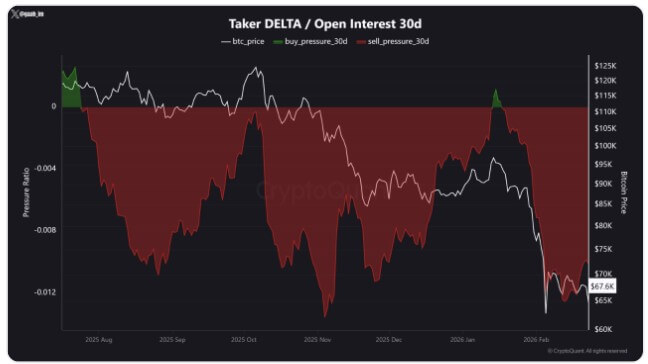
CryptoQuant derivatives data confirms bearish dominance on futures markets reflected through persistently negative funding rates near current lows ($62K-$68K), contrasting prior positive funding environments seen near previous bottoms (~$80K).
Since July 2025 selling pressure remains strongest in three months while buy limit orders serve mainly passive absorption roles—not driving prices higher actively.
Though short squeezes could emerge if bearish positioning becomes overcrowded combined with waning spot sales—the prevailing structure indicates defensive trading behavior lacking clear signs of renewed appetite for risk.
< h3 > ; Options Market Sentiment Reflects Persistent Caution </h3 > ;
<em> ;CryptoSlate</em> previously noted sustained demand for downside protection post-Bitcoin rebound above $70K on February 6th—with put options clustered between strikes ranging from $60K downwards toward expiry on February 27th.</em>
<blockquote> ;Strong put buying following rallies generally implies traders assign meaningful probabilities toward further declines despite dip-buying activity.</blockquote>