At the time of writing, Bitcoin is valued at $69,383, boasting a market cap of approximately $1.38 trillion. The cryptocurrency sees a robust 24-hour trading volume of $45.37 billion. Its price fluctuated between $67,098 and $70,434 during the day, indicating that the market is still recovering from a significant multi-day decline.
Bitcoin Market Analysis
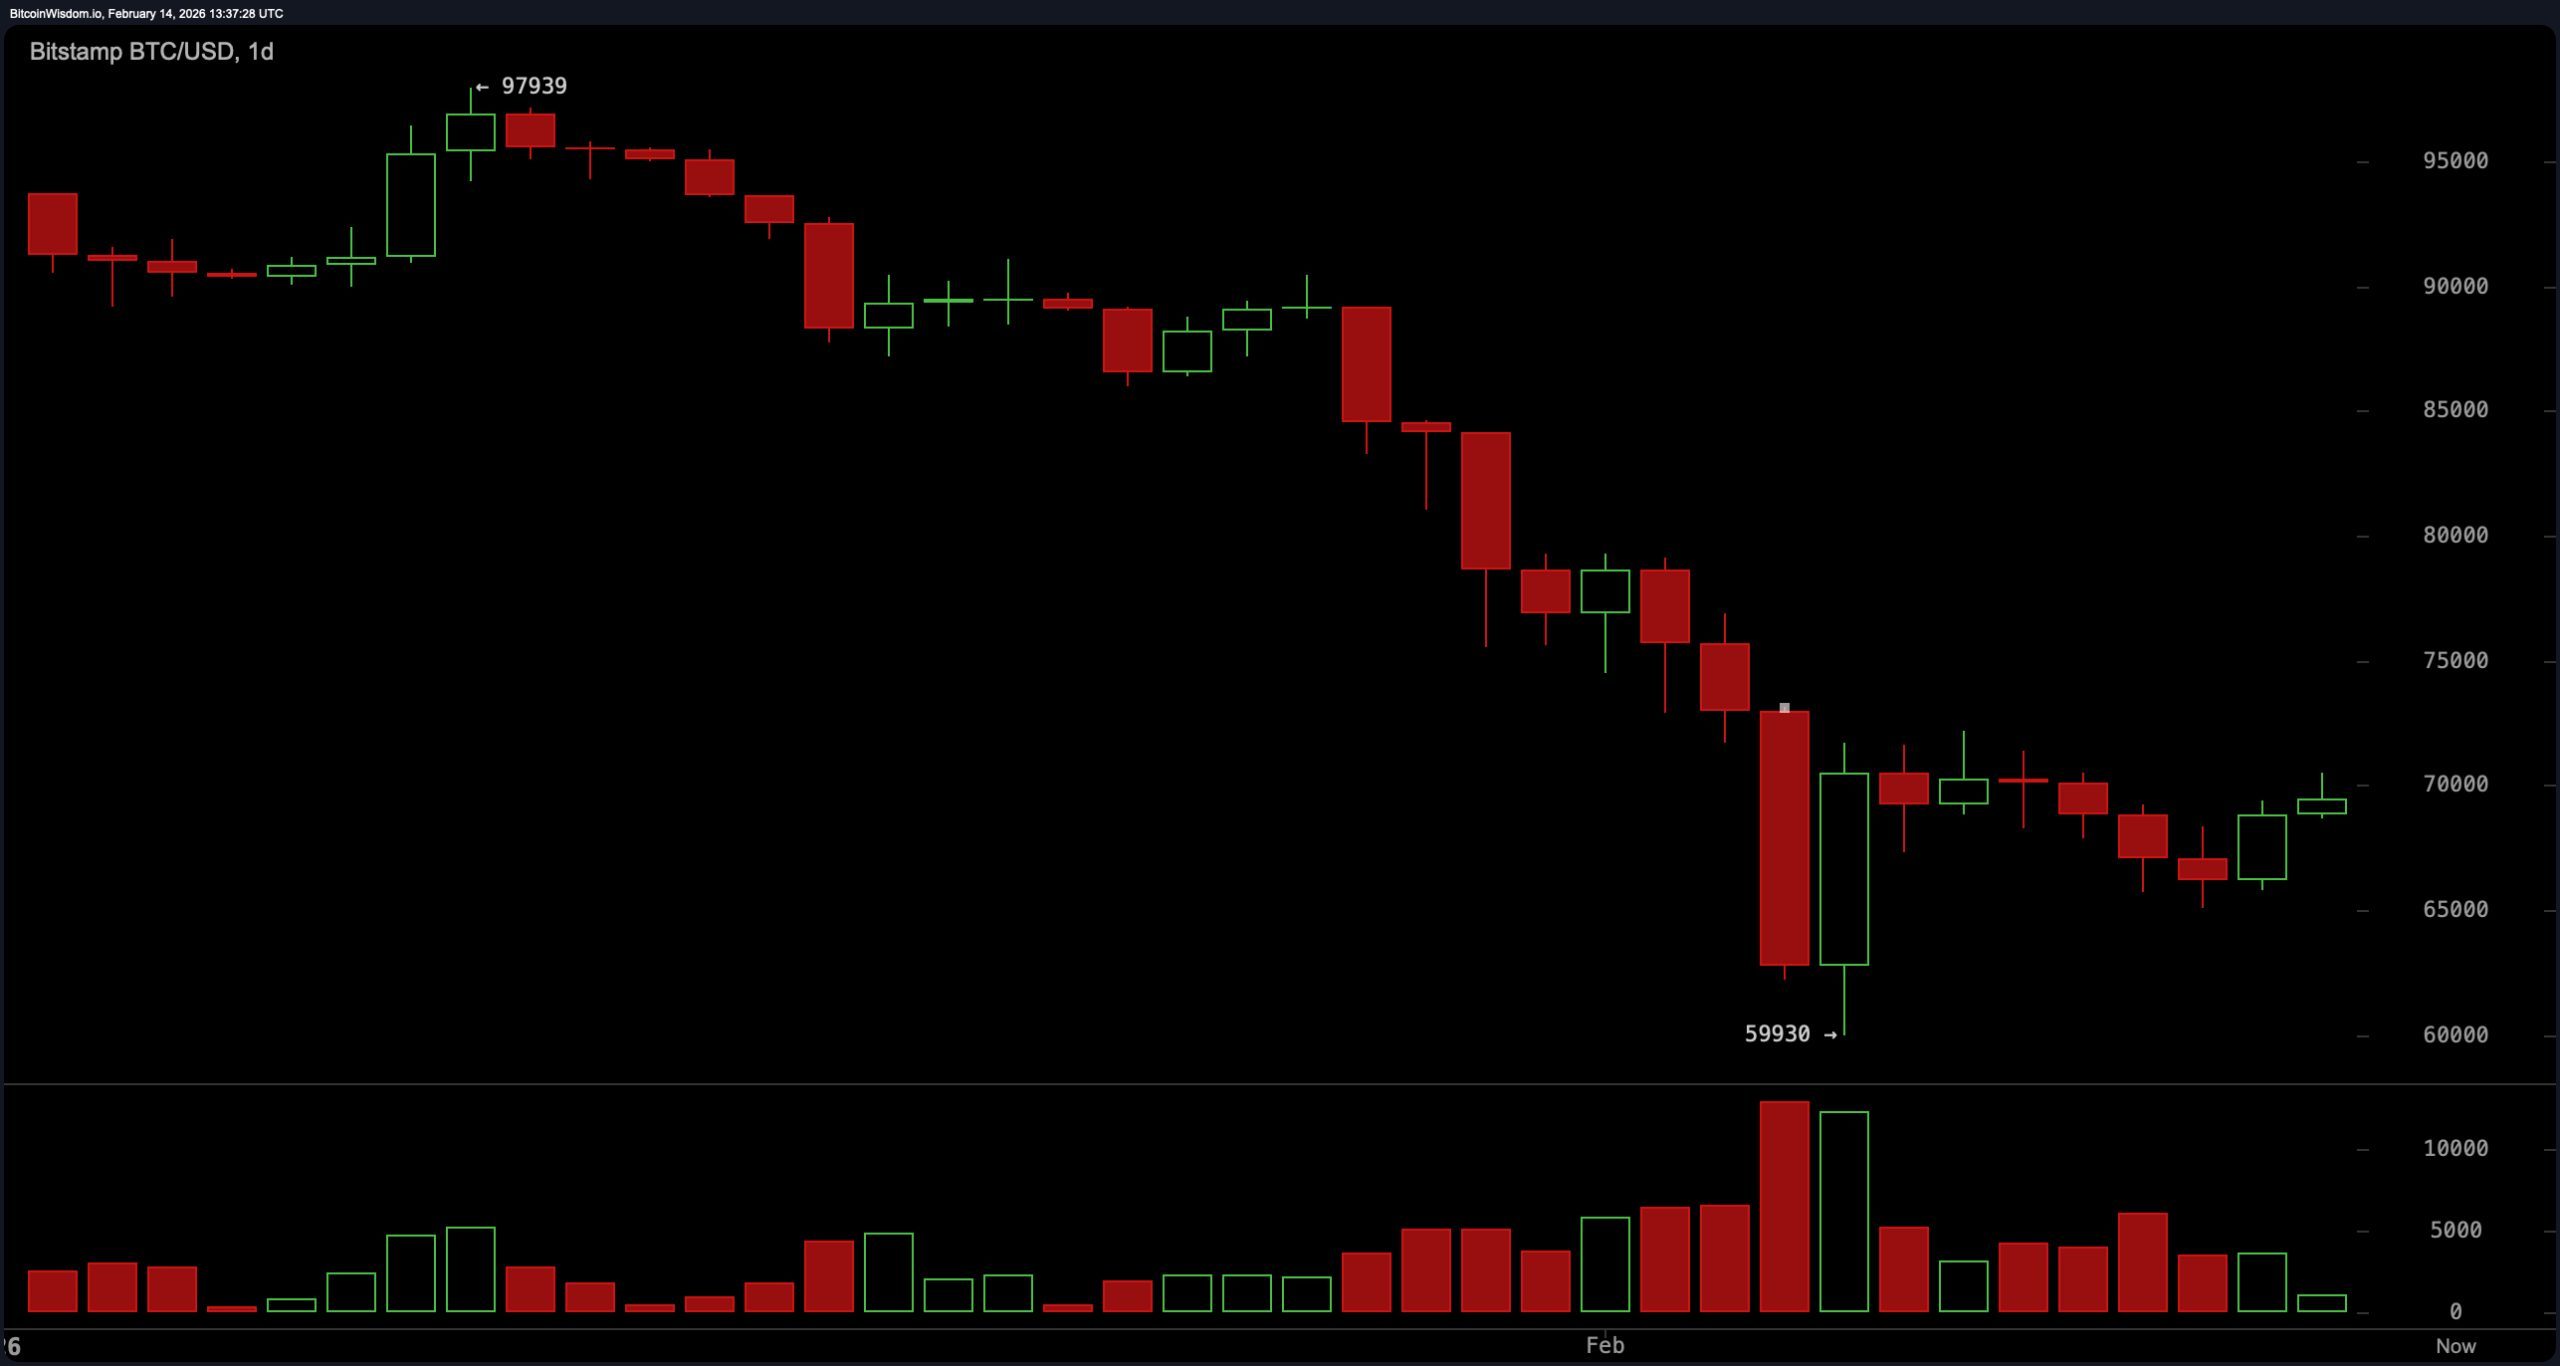
Following a sharp drop exceeding 30% from around $97,900 down to the mid-$65,000 range, Bitcoin appears to be seeking stability. However, long-term charts suggest that it remains in a phase characterized by heavy selling pressure. Although volatility has slightly diminished recently, key resistance levels continue to challenge upward momentum.
The daily chart reveals that Bitcoin’s corrective pattern remains intact after its plunge from nearly $98K unfolded in rapid succession with strong selling volume on February 12th—over 10,000 units traded—about twice the average daily volume confirming distribution phases. Currently hovering near the 38.2% Fibonacci retracement level at roughly $65K; resistance zones are identified around $70K and further up near $75K. The price action resembles a descending triangle formation as Bitcoin consistently closes below important dynamic resistance lines. Unless it manages to break above and hold over $72K with increasing trade volumes soon, bearish sentiment will likely persist despite occasional stabilization attempts.
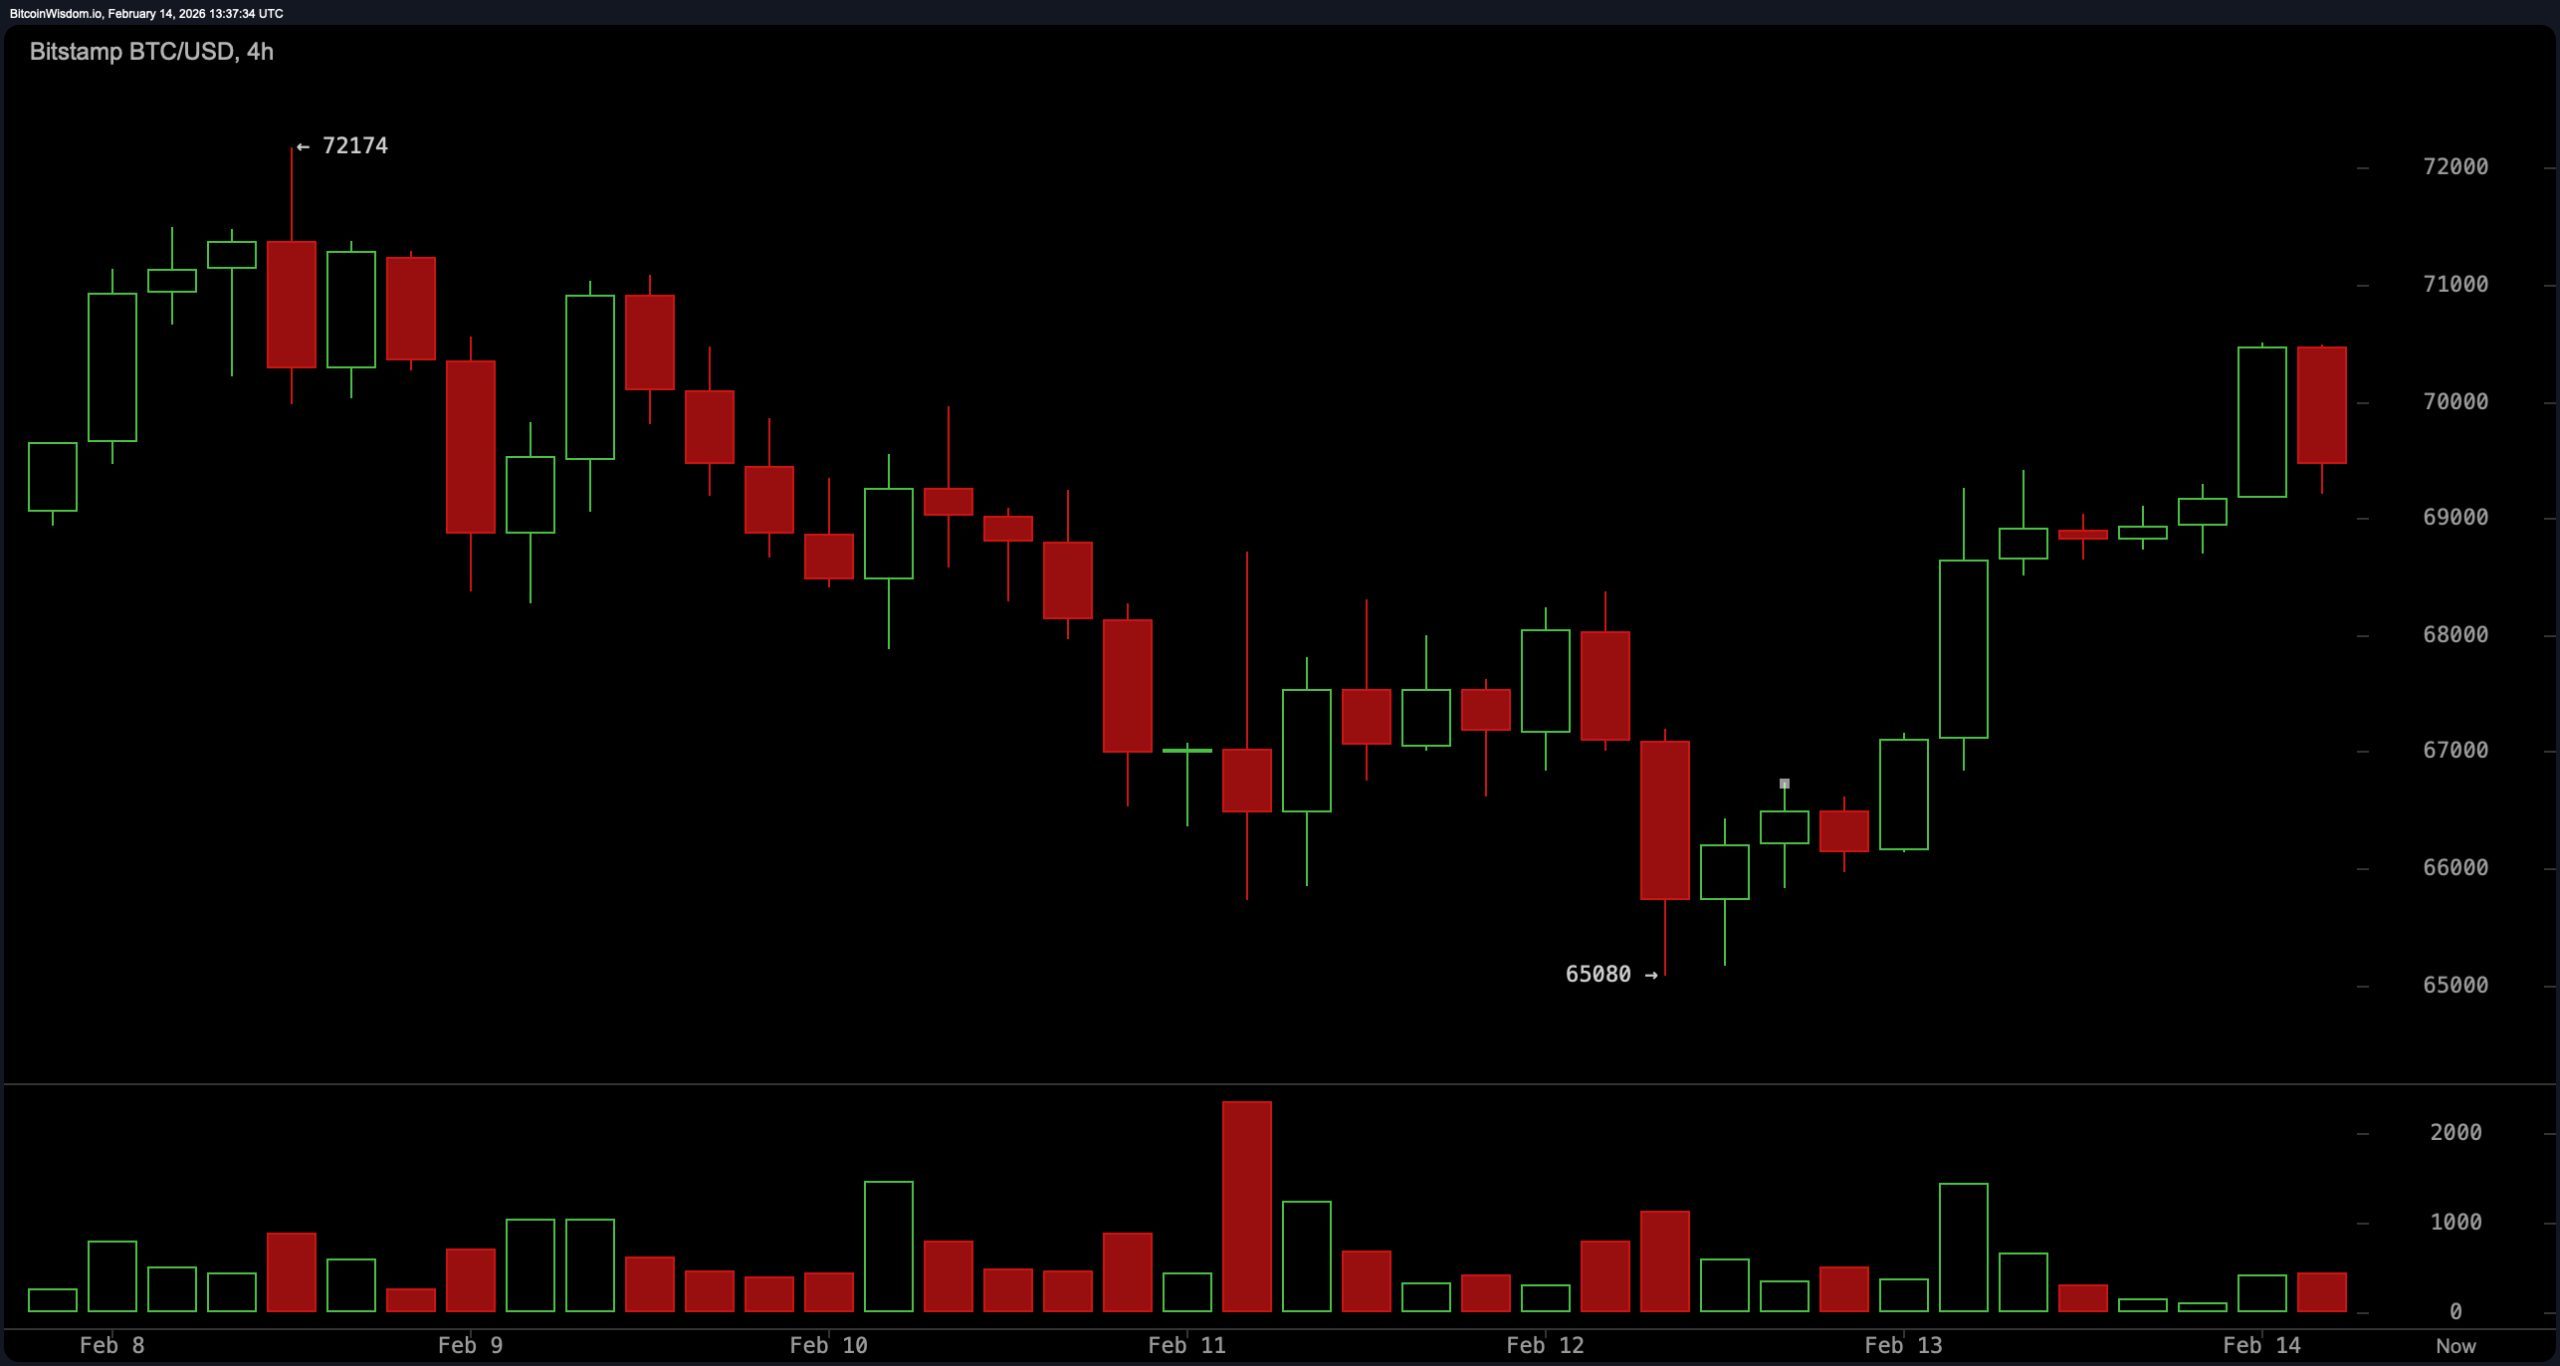
The four-hour timeframe supports this cautious outlook as well: Bitcoin dropped nearly 9.5% from about $72,174 down to approximately $65,800 before consolidating tightly between roughly$65, 800 and $66, 500. Several consecutive bearish marubozu candles along with an upper wick shooting star pattern near ~$69, 500 preceded this downward acceleration.
Volume surged beyond 2,000 units during February 12–13 sell-off,a notable increase compared with typical ranges between 800–1&comma200 units,suggesting capitulation among sellers.
Since then,rallies have occurred on subdued volumes under < 500 units indicating weak buying conviction.
Support levels remain firm within $‘$65&comma000-’$65&comma800 while resistances are seen at $''$67,000'';and $70,000.The price continues testing lower boundaries inside what looks like descending channel structures.
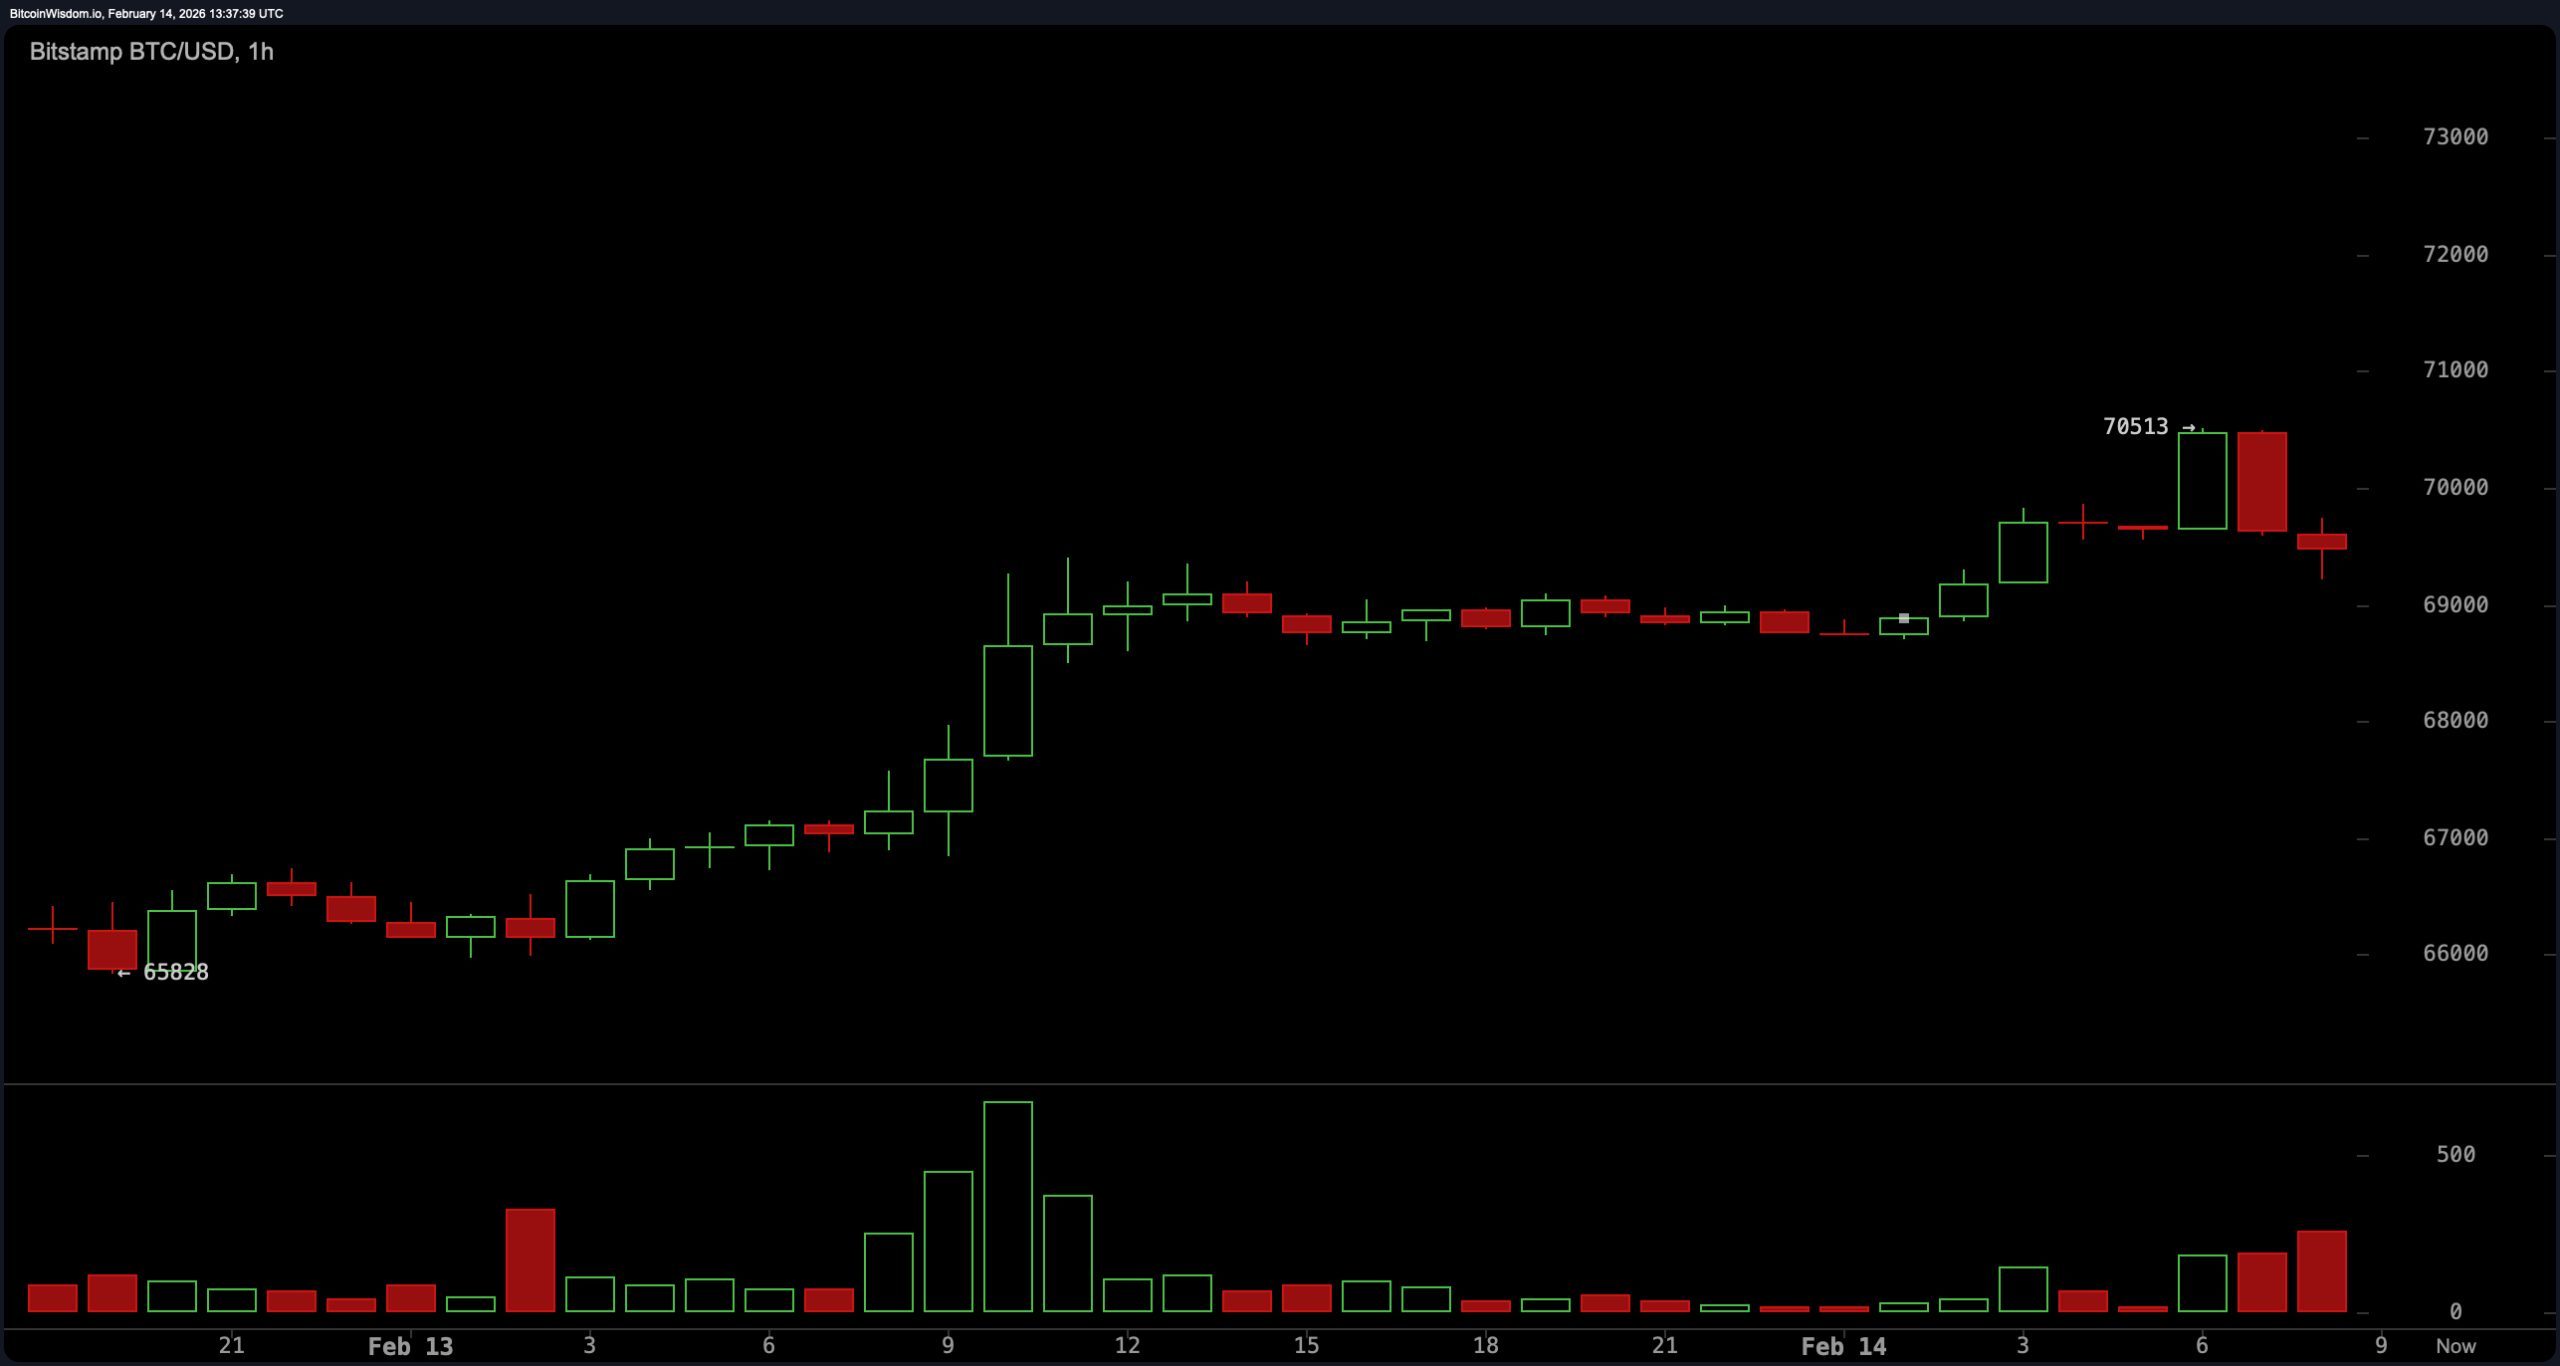
The hourly chart shows heightened but irregular volatility patterns.amp; after rebounding sharply from lows near $65,628 up toward $70,513,Bitcoin formed double tops close to $68,000 before retreating back toward about $66,000.
Tails extending above approx$70、500 indicate exhaustion while declines late in sessions occurred on decreasing volumes below one hundred trades per hour.
The current pricing sits beneath daily VWAP (volume weighted average price) around $67、500 whilst wedge-like compression suggests imminent directional breakout or breakdown possibilities.Repeated failed attempts pushing higher confirm persistent overhead supply pressure leaving short-term structure fragile.
Technical oscillators point towards tentative stabilization without clear reversal signals yet:
– RSI rests neutral around value thirty-seven after bouncing off oversold conditions
– Stochastic indicator also hovers near thirty-seven reflecting indecision
– Commodity Channel Index stands negative fifty-four signaling weak momentum
– ADX measures fifty-five confirming prevailing strong trend predominantly downward
A deeper look into momentum indicators:
– Awesome Oscillator stays deeply negative at -14, 028
– MACD reading remains bearish at -5, 371
– Short-term momentum registers slight relief signs at -3, 555 suggesting possible minor upward corrections within overall bear framework
Bullish Perspective:
If support zone between $’$65,’000-’’$65,’800 holds firm coupled with reclaiming threshold of &$apos;’$67,’00’0’’ accompanied by rising trading activity,$bullish momentum could gain traction targeting next resistances around &$apos;’$70,’00’0’’ potentially challenging &$apos’$72,’00’0&rsquo’. Oversold readings across shorter intervals combined with diminishing downside volumes imply technical feasibility for relief rallies ahead.
Bearish Outlook:
As long as prices remain capped below &#36;;70000&#59;, alongside failure breaking above major moving averages widely used for trend identification,the dominant bias favors continuation of correction rather than recovery.
A decisive breach beneath critical support zone (~&#36;;65000) would open pathways towards lower targets such as ~&#36;;60000 reinforcing structurally bearish stance.
❔️ Frequently Asked Questions (FAQ)
•} What was bitcoin’s value on February 14th ,2026?
Bitcoin traded close to $ ;69 ,383 within intraday range spanning $ ;67 ,098 through $ ;70 ,434 .
&# x2022 ; Is bitcoin currently bullish or bearish ?
Presently bitcoin undergoes short term corrective phase remaining under critical resistances plus multiple moving averages signaling caution.
&# x2022 ; What are key support/resistance points ?
Immediate supports lie between ~&# x241 ;65000 – ~&# x241 ;65800 whereas resistances cluster near ~$67000,$70000,and~$75000.
&# x2022 ; How do technical indicators read ?
Oscillators mostly indicate neutral-to-bearish pressures while MACD together exponential MAs highlight ongoing downside risks.