Bitcoin’s recent downturn has sparked comparisons among traders to previous market cycle shifts, with two particular chart analyses gaining significant attention. One suggests Bitcoin might remain confined within an 8-month trading range between $45,000 and $60,000, while another interprets the roughly 50% price drop as a result of sellers dominating buyers rather than being triggered by any single news event.
Trader Highlights Bearish Pattern Similar to 2021, Predicts Extended Bitcoin Range
A user on X named Aralez shared a weekly chart of Bitcoin versus Tether from Binance, claiming that this setup had previously anticipated a major market decline. Aralez believes the current price movement mirrors the bearish cycle seen in 2021. The post notes Bitcoin was trading near $69,100 and forecasts an upcoming phase characterized by sideways accumulation lasting about eight months within the $45,000 to $60,000 band.
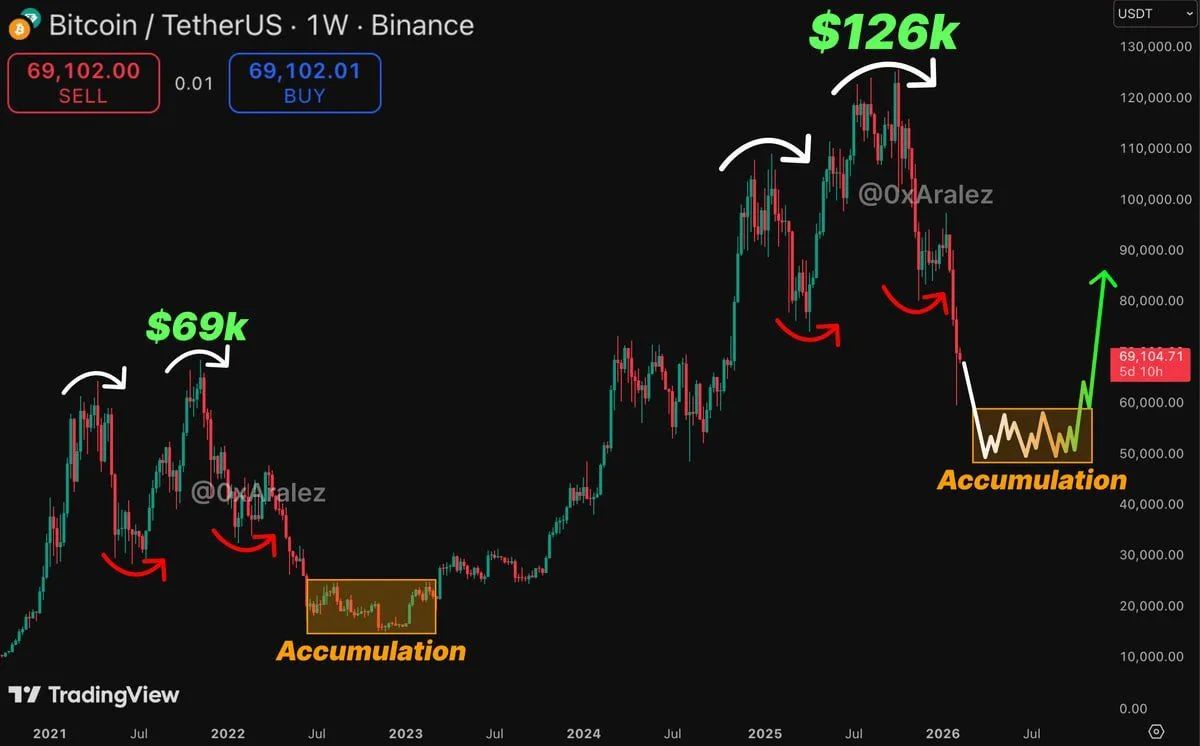
Chart illustrating repetition of Bitcoin’s 2021 bear cycle. Source: Aralez on X
The annotated graphic emphasizes two key peaks followed by selloffs during past cycles. It marks the 2021 high close to $69,000 before showing a sharp decline into early 2022 and then highlights an “accumulation” zone around low-$20K levels enclosed in a box. On its right side is another peak near $126,000 with curved arrows tracing swing highs and pullbacks that suggest this recent drop echoes prior topping patterns.
Following the latest fall in price, the chart projects another boxed accumulation region between approximately $45K and $60K with jagged lines indicating sideways movement before potentially moving upward again. A green arrow pointing toward roughly $80K hints at possible recovery after this consolidation period; however,the scenario remains speculative depending on whether prices stabilize within that range or continue falling below it.
Daan Crypto Trades Notes Over Half Drop Reflects Seller Dominance Rather Than Single News Event
Daan Crypto Trades commented on X that since Bitcoin has dropped more than fifty percent from its all-time high level,the current bearish phase feels harder to buy into because no singular headline explains it fully.He describes this trend as driven primarily by supply-demand imbalance where sellers outweigh buyers,and adds sentiment is weak due to lack of clear positive catalysts for traders.
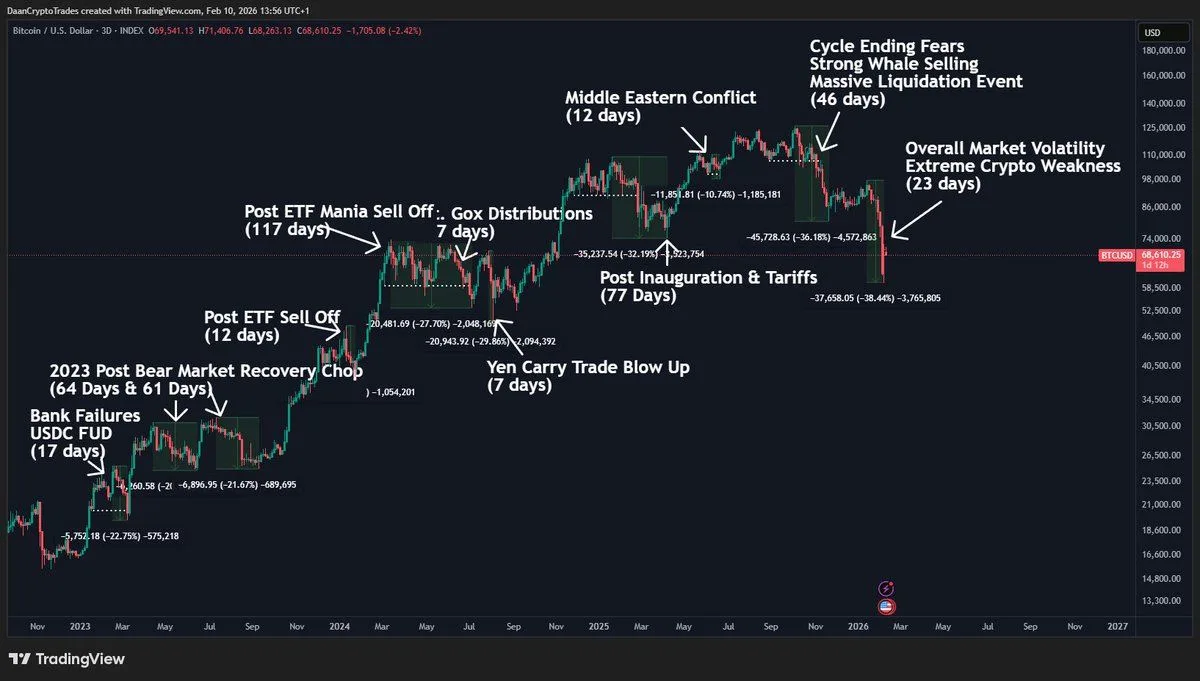
Chart mapping various selloff phases alongside changing market narratives.Source: Daan Crypto Trades on X
The TradingView illustration dated February 10 annotates multiple pullbacks throughout broader uptrends linking earlier declines with specific events such as “Bank Failures USDC FUD,” “Post-Bear Market Recovery Chop (2023),” “Post ETF Sell Off,” “ETF Mania Sell Off,”and“Gox Distributions.” Each label includes duration counts reflecting how long these slumps lasted.
The timeline continues marking episodes like “Yen Carry Trade Blow Up,”“Post Inauguration & Tariffs,”and“Middle Eastern Conflict.” Additionally,it highlights an extended period titled“Cycle Ending Fears Strong Whale Selling Massive Liquidation Event (46 days).”
Toward the right edge,the chart shows another steep decline labeled“Overall Market Volatility Extreme Crypto Weakness (23 days),” projecting further downward pressure into early 2026.A price tag places Bitcoin near$68,610.The commentary stresses absence of any dominant narrative capable of easing selling pressure psychologically among traders during this stage.
DaanCryptoTrades concludes many investors are waiting patiently for momentum restoration.He advocates for cautious gradual accumulation while remaining adaptable amid uncertain future developments.