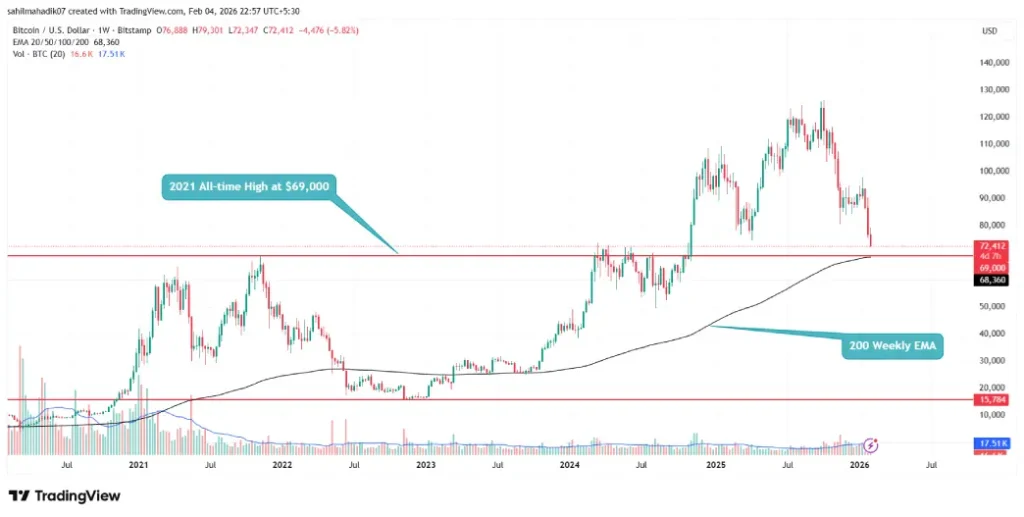
The recent correction in Bitcoin’s price has fallen just 4% short of retesting its November 2021 peak at $69,000.
Bitcoin UTXOs currently experiencing unrealized losses have surged to between 27% and 30%, reflecting stress levels similar to those observed during May 2022.
During a significant bear market phase, the price of $BTC briefly dipped below the weekly 200 exponential moving average before regaining upward momentum.
On Wednesday, February 4th, Bitcoin’s value dropped nearly 3%, slipping beneath the psychologically important $75,000 threshold. A notable increase of 39% in trading volume suggests that selling pressure remains strong and raises concerns about a possible extended downtrend. As prices hover under $75K, both on-chain data and derivatives markets point toward a critical juncture for $BTC, which could shape its medium-term trajectory.
$BTC’s Unrealized Losses Signal Potential Cycle Warning
The recent market pullback pushed Bitcoin’s price down to around $73,000—the lowest level seen since late last year. With macroeconomic uncertainties and geopolitical tensions influencing sentiment, Bitcoin continues fluctuating near the $75K mark.
Market participants are closely watching whether maintaining above this level can help rebuild bullish momentum or if breaking lower will accelerate defensive moves and trigger further liquidations.
The derivatives landscape reflects this caution: futures open interest declined alongside falling prices; funding rates turned negative amid increased selling; implied volatility remains elevated for upcoming options expirations; and mild backwardation is evident on the volatility curve. Traders appear willing to pay premiums for protection against sudden drops rather than betting on upside gains—evidenced by growing demand for out-of-the-money put options as crash hedges.
Additional insights come from on-chain metrics showing that roughly 27–30% of Bitcoin UTXOs are now underwater—mirroring patterns from May 2022 downturns. Historically, when this metric surpasses the upper bound of that range (above ~30%) persistently, it signals mounting loss positions leading to prolonged sell-offs. Conversely, if it stabilizes or declines below this threshold again, it may indicate seller exhaustion and potential stabilization or recovery phases ahead.
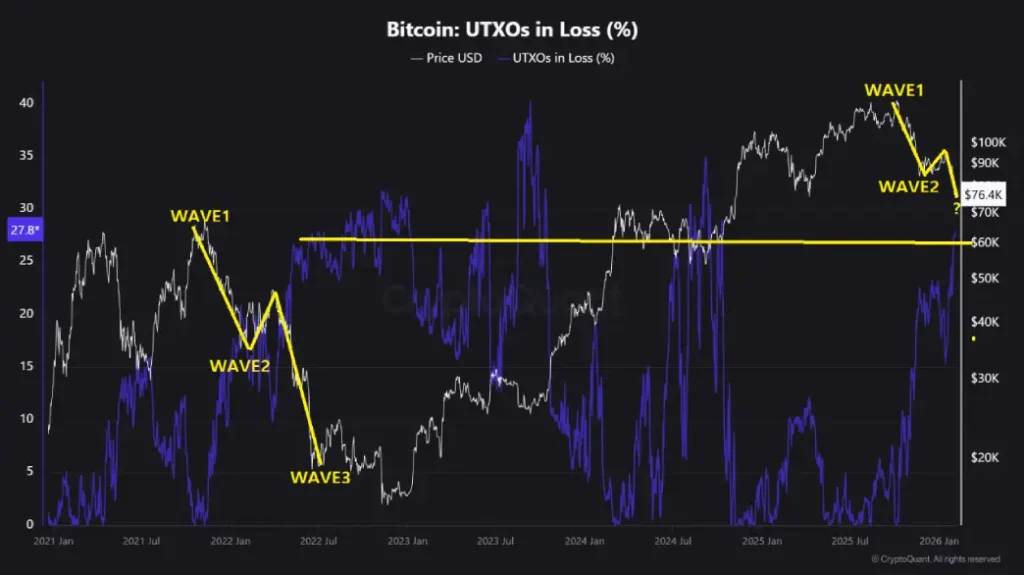
The chart illustrates recurring cycles where unrealized loss percentages spike dramatically during drawdowns—with previous peaks nearing 40% coinciding with major price swings. Current readings place these metrics close to levels historically preceding both deeper corrections as well as subsequent rebounds within past cycles.
Taken together, these factors make the zone between $70K-$75K a crucial battleground where market participants must weigh accumulated stress against potential renewed selling pressure or recovery prospects.
Bitcoin Price Eyes Support Near Its All-Time High From 2021
Over the past three weeks alone, Bitcoin has experienced a sharp decline from approximately $97,398 down to about $72,350—a drop exceeding twenty-six percent—and its total market capitalization fell accordingly to around $1.44 trillion USD.
If bearish momentum persists unabatedly through continued selling activity,the cryptocurrency could slide another four percent toward retesting its all-time high set back in late-2021 near$69K — an area often revisited during bear-market bottoms due to historical volume concentration at prior cycle peaks driving support zones based on remembered liquidity pools within order books .
The accompanying volume profile reveals sparse order book depth between$70k -$75k , creating what traders call an “air pocket” where prices might plummet swiftly without much resistance . Meanwhile ,the weekly chart highlights how closely alignedthe200 EMA slope lies nearthis region ,providing robust technical supportwhere buyers might step backin .
$BTC$/USDT – Daily Chart
Given these conditions , consolidation withinthisprice band appears likelybefore any decisive directional move occurs .
Also Read :$ BTC ETFs experience declines while bitcoin dipsto76 K ; meanwhile XRP , ETHand SOL ETFs see gains.