
Bitcoin Supply Overview: Cost-Basis Ranges, Miner Pressure, and ETF Flow Indicators
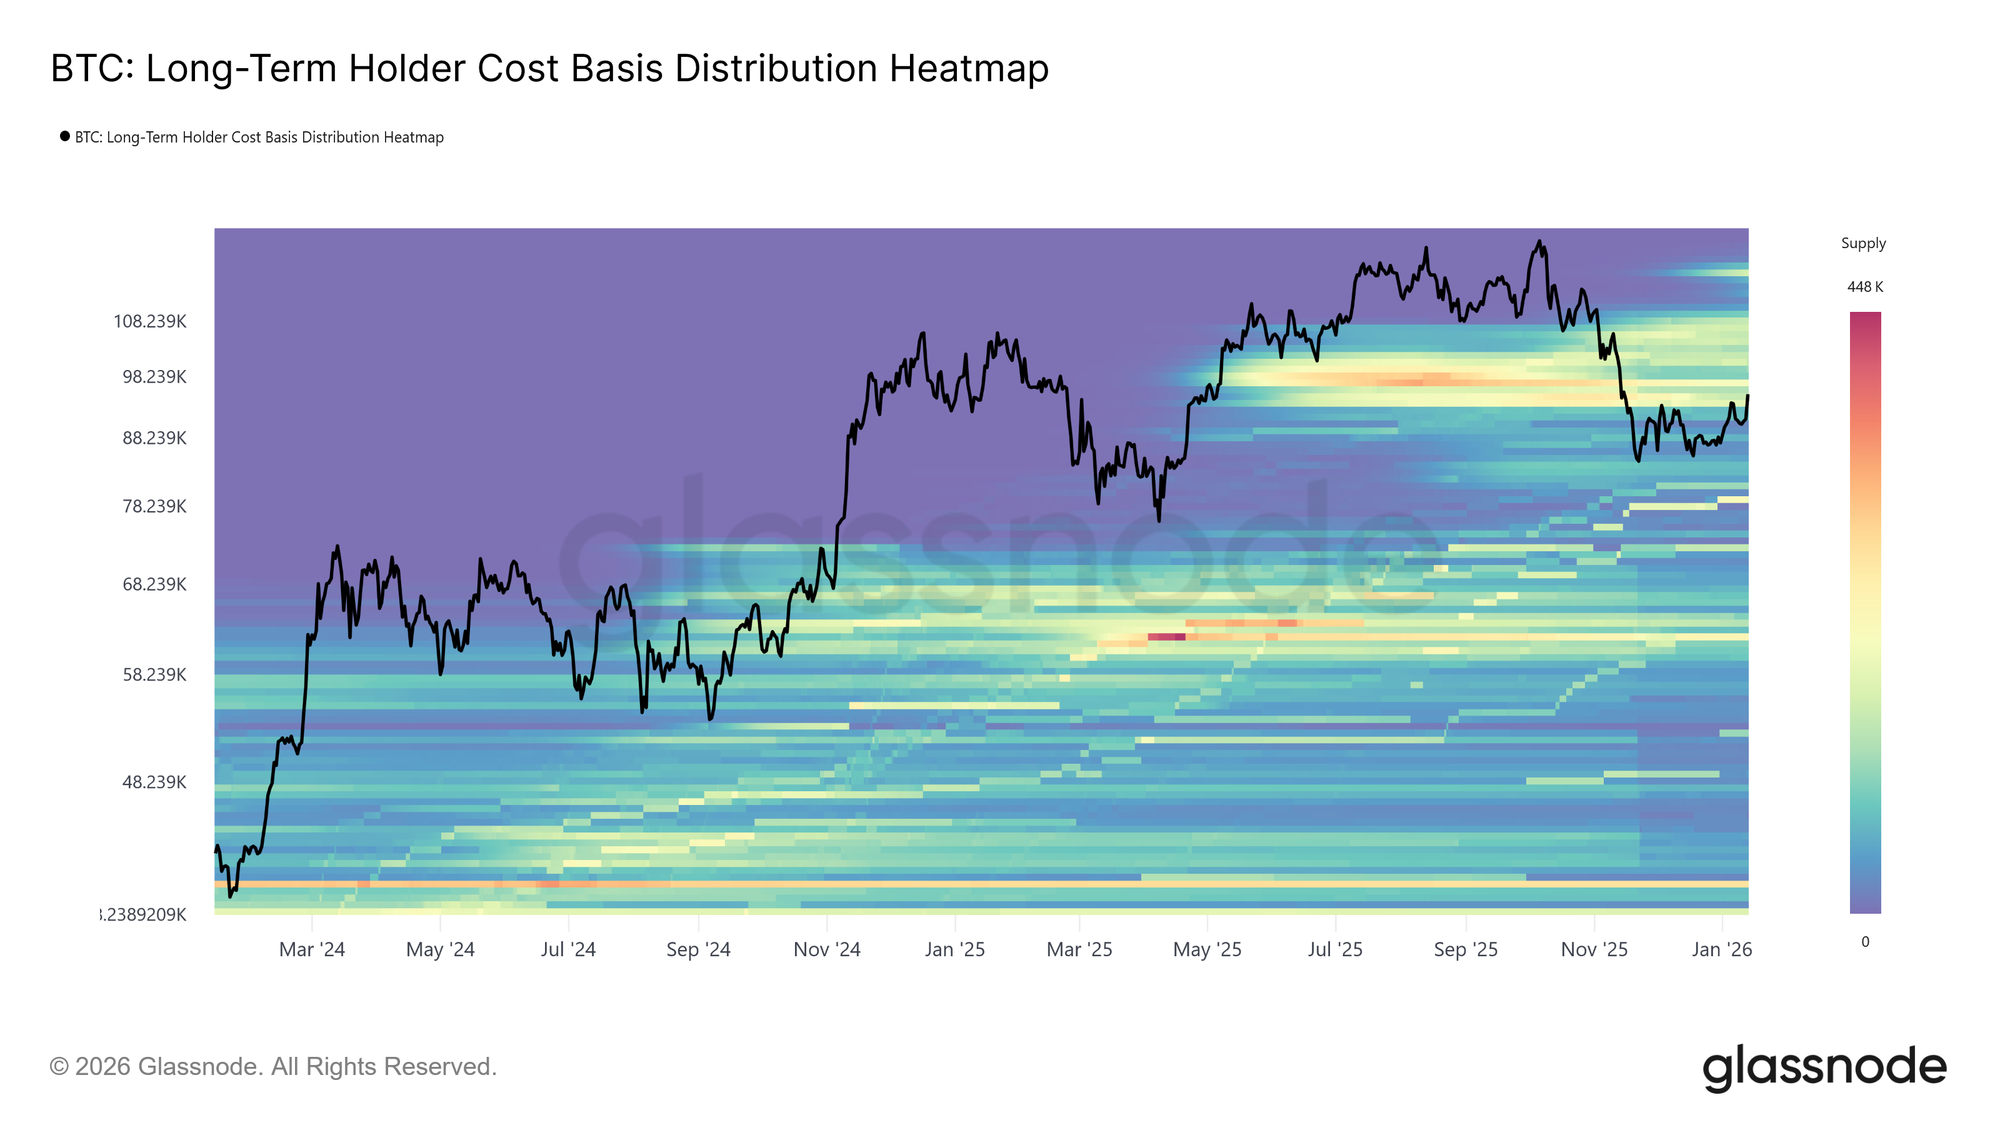
Currently, Bitcoin is trading beyond the $93,000 to $110,000 cost-basis range that Glassnode identifies as an “overhead supply” zone.
This scenario shifts the focus for the upcoming quarter from issuance schedules to miner cash flow dynamics and holder activity. As per Glassnode’s Week On-chain W02 2026 report, Short-Term Holders (STH) have a cost basis close to $98,300.
This figure often serves as a benchmark determining whether recent purchasers increase their holdings or sell during price recoveries.
Meanwhile, mining markets reflect expectations of tight profitability conditions.
The Hashrate Index summary dated January 26th, 2026 shows that the six-month forward hashprice curve averages about $33.25 per PH/s daily (approximately 0.00041 BTC), which falls below the breakeven threshold of roughly $39.50 for many miners depending on operational expenses and hardware efficiency.
Context from CryptoSlate: Miner stress narratives frequently revolve around this interplay between profitability and difficulty adjustments—highlighted in reports such as “Bitcoin’s hashrate continues to fall as price spikes fail to reactivate mining rigs.”
An additional factor this quarter is how ETF flows influence tradable supply—either absorbing it or releasing pressure into markets.
Data from SoSoValue recorded net outflows totaling $681 million from spot Bitcoin ETFs during the first full trading week of 2026 amid risk-averse sentiment driven by interest rate forecasts and macroeconomic news. The following week saw net outflows worsen to -$1.3 billion—the largest since May 2025.
For further insights on early-2026 flow patterns see CryptoSlate’s coverage titled “Bitcoin breaking $126K shows clear three-year trajectory but brutal $1.3B exodus alters near-term outlook.”
Main Insights
- The Bitcoin protocol fixes issuance with a maximum supply capped at 21 million coins plus reward halvings every 210k blocks. Short-term supply shocks typically stem more from tradable float fluctuations and incentive structures than block rewards themselves (Blockchain.com data).
- Glassnode identifies current overhead supply between approximately $93K–$110K with STH cost basis near $98,300—a critical demand absorption test zone this quarter (Glassnode W02 report).
- The network hashrate recently adjusted downward due to stress factors—with seven-day SMA dropping from about 1,003 EH/s down to roughly 966 EH/s while difficulty declined by over three percent on January 22nd (Hashrate Index data).
- A six-month forward hashprice estimate around ~$39.50 per PH/s/day keeps miner treasury management under scrutiny alongside shutdown risks tied closely to operating costs and equipment efficiency metrics (Hashrate Index analysis).
- ETF inflows/outflows remain pivotal after severe net withdrawals exceeding one billion dollars in early January impacted market liquidity significantly.
User Groups Benefiting From This Analysis
- Long-term investors monitoring cohort-based supply trends along with maturation cycles and cost-basis bands
- Swing traders focusing on short-term holder behavior relative to overhead resistance levels
- Institutional desks tracking ETF liquidity regimes combined with miner-driven selling pressures
- Mines operators managing exposure based on hashprice fluctuations plus timing difficulty adjustments strategically
Catalysts To Watch In The Coming Quarter:
- The price action surrounding STH cost basis (~$98,300) including attempts at reclaiming position within the defined overhead band ($93K–$110K)
- The recovery trajectory of six-month forward hashprice towards breakeven levels (~$39.50 PH/s/day) versus actual spot prices reported by Hashrate Index
- Tight monitoring of subsequent difficulty changes post-January adjustment (-3.28% drop)
- Dynamics in exchange venue flows where Binance showed buy dominance while Coinbase selling pressure eased according Glassnode’s latest weekly report
- The ongoing weekly spot Bitcoin ETF flow statistics following record outflows last month
A Primer On Issuance Mechanics And Halving Events — Fixed Versus Variable Factors
Total Bitcoin issuance follows a deterministic path embedded within its protocol layer — capped at exactly twenty-one million coins with subsidy halving events occurring every two hundred ten thousand blocks.
This predictable schedule underpins long-term valuation models while allowing quarterly issuance math forecasting.
However, supply accessible —i.e., inventory available for trading via miners’ sales or holders’ distribution plus creation/redemption through ETFs—is what truly drives short term market volatility.
Supply shocks generally emerge here because although new coin generation is fixed, supply-side liquidity decisions are conditional , causing fluctuations within quarters rather than across them.
Evolving Miner Economics And Their Impact On Selling Pressure — Why Hashprice Is A Key Supply Lever
Mined Bitcoins represent an elastic source of recurring distribution since miners periodically sell freshly minted coins depending upon operational viability.
Late January data exemplified this elasticity when Hashrate Index noted seven-day average network hashrate fell notably—from ~1000+ EH/s down closer toward ~966 EH/s—and subsequently triggered a downward difficulty adjustment (-~3%) easing margin pressures.
Forward-looking pricing also signals constrained margins:
The same index projects an average daily revenue (“hashprice”) near ~$33 per PH/s over next half year compared against estimated breakeven points ranging between ~$39-$40 dependent upon machine type/costs.
This creates three plausible scenarios shaping Q1 outcomes:
- 任意回改到�%; 有限的肥/盘/⼆/⼆; ル. If hashprices hover around current projected values (~33$/PH), higher-cost operations face tighter budgets leading potentially periodic shutdowns accompanied by forced coin sales.
- 【) Difficulty relief scenario:
Further declines in hashrate may prompt successive reductions in mining difficulty which effectively boost revenue/unit hashing power even if BTC prices remain stable.
This mechanism reduces compelled liquidations among marginal producers—as demonstrated recently. - 】) Macro compression:
If adverse macro conditions depress BTC prices simultaneously keeping hashprices near break-even zones then accelerated rig shutdowns could occur triggering feedback loops involving repeated downward difficulty resets whose timing remains uncertain. - No immediate scarcity emerges right after halving events despite popular belief because block-based issuance remains transparent whereas quarterly variations arise mostly due liquidity choices made by miners &&a href=#holders”>holders alike.
- No hard cutoff exists exactly at day155 distinguishing long vs short term holders since weighted logistic functions smooth transitions impacting interpretations close those thresholds.
- Miner capitulation isn’t instantaneous but unfolds gradually via interplay between hashrate drops followed later by mechanical readjustments restoring equilibrium profits unit-wise hashing power .
<th scope="col">Area</th<
<th scope=& quot ; col " & gt ; Metric< / th & gt ;
<th scope = " col " & gt ; Current Reference< / th & gt ;
<th scope = " col " & gt ; Importance This Quarter< / th&g t ;& Source< / th&g t ; <tbody&g t ;
<tr&g t ;
P rotocol<td/& g t ; Max Coin Cap + Halvings Every Block Interval<td/& g t ; Defines Fixed Issuance Schedule Focusing Attention Toward Tradable Float Variability<td/& g t ; & Blockchain.com
Mining
Network Hash Rate(7-Day Average)
$” target=”_blank”>$BTC
Indicator For Shutdown Risk And Revenue Stress Among Miners.td/>
& Has h r ate Ind e x Jan .26 ,20 _26 td/> <Td Mining
<TD Difficulty Adjustments
-~03 % Drop Jan .22 TD/ TD Mechanical Relief Valve Moderating Profit Margins TD/
TD Has h r ate Ind e x Ja n .26 ,20 _26 TD/
<TD Mining TD/
<TD Forward-Looking Daily Revenue Per Ph/S Day(Two Quarters)
$33+/PH/S/DAY Approximate Forecast TD/ TD Treasury Management Proxy For Forced Selling Probability.T D /
T D H ash rat e I ndex Fe b .03 T D /
TR /
< T D H old ers T D /
< T D O ver head Cost Basis Band Range(Typical Resistance Zone)
< T D ~93000 -~11_00_00_
<D TH E G LA SS N OD E WO _R EP ORT_
/TR >/tbody >
<Strong Red Flags To Monitor
nnnAny statements claiming recent percentage decreases in exchange balances lacking up-to-date datasets should be viewed skeptically.nBreakeven thresholds vary considerably based on operating expenditures plus hardware types so generalizations must be qualified accordingly.n
nn<Strong Action Plan For MonitoringnnnnTrack weekly signs/magnitudes related directly toward ETF inflow/outflow dynamics referencing SoSoValue sources especially after significant negative weeks like -$681M seen early Jan.nnnObserve each new epoch’s impact on network difficulty relative changes post-Jan22 reduction alongside corresponding shifts in total hashing power providing insight into miner financial stress points.nn
Monitor daily comparisons between real-time spot revenues earned per unit hashing power against longer-dated futures averages indicating tightening or easing conditions affecting forced sales likelihood.
Assess whether Long Term Holder supplies continue declining or begin rising consistent with maturation-outspending balance described by GlassNode.
Watch key price levels proximate $98,300,and overarching $93,000-$110,000 range representing important behavioral inflection points tied closely back toward established STH/historical acquisition costs.
Miner treasury policies can modulate realized selling intensity throughout any given period.
Bifurcation Between Long-Term And Short-Term Holders — Origins Of Overhead Supply Bands
Rather than pinpointing overhead resistance at single fixed prices, Glassnode maps it using ranges reflecting underlying investor cohorts’ purchase costs spanning approximately $93k-$110k. This includes short term holders centered near ~$98k representing recent buyers who may either offload gains during rallies or hold firm.
Understanding these ranges matters greatly because they define zones where prior accumulation turns into potential sell pressure unless fresh demand absorbs existing inventories efficiently enough preventing renewed distributions.
Holder activity softened compared against late last year without transitioning fully into accumulation phases:
Long Term Holder supplies continue declining albeit slower compared with heavy Q32025-Q42025 disposals;
Net realized profits among LTH currently stand lower (~12,.800 BTC/week) versus cycle highs exceeding >100k/week previously
Durability hinges critically upon maturation-driven supplies surpassing LTH spending rates pushing overall LTH holdings upward again thus alleviating immediate selling risks inside these bands.
Note regarding methodology differences readers should consider when comparing dashboards:
Glassnode employs logistic weighting centered around day155 holding periods rather than strict cutoffs creating smoother cohort transitions.
Busting Common Misconceptions About Supply Dynamics:
These variables must always be contextualized alongside immutable elements like bitcoin’s programmed emission schedule ensuring holistic perspective when interpreting market movements.