Bitcoin’s recent decline was neither abrupt nor chaotic; instead, it unfolded with precision, intent, and an unforgiving nature.
Bitcoin Slips After Crucial Support Level Breaks Down
Technical analysis reveals that the downturn was anticipated well before the final plunge. Bitcoin reached a peak near $79,300 and lingered there for hours while gradually forming lower highs as momentum quietly diminished.
Efforts to regain the $78,500 to $79,000 range repeatedly failed as sellers increasingly dominated each attempt. By early afternoon on February 3rd, this fragile structure collapsed, triggering a series of large red candlesticks that pushed prices sharply downward. The surge in trading volume during this drop confirmed that it was a genuine market move rather than a minor fluctuation or low-liquidity event.
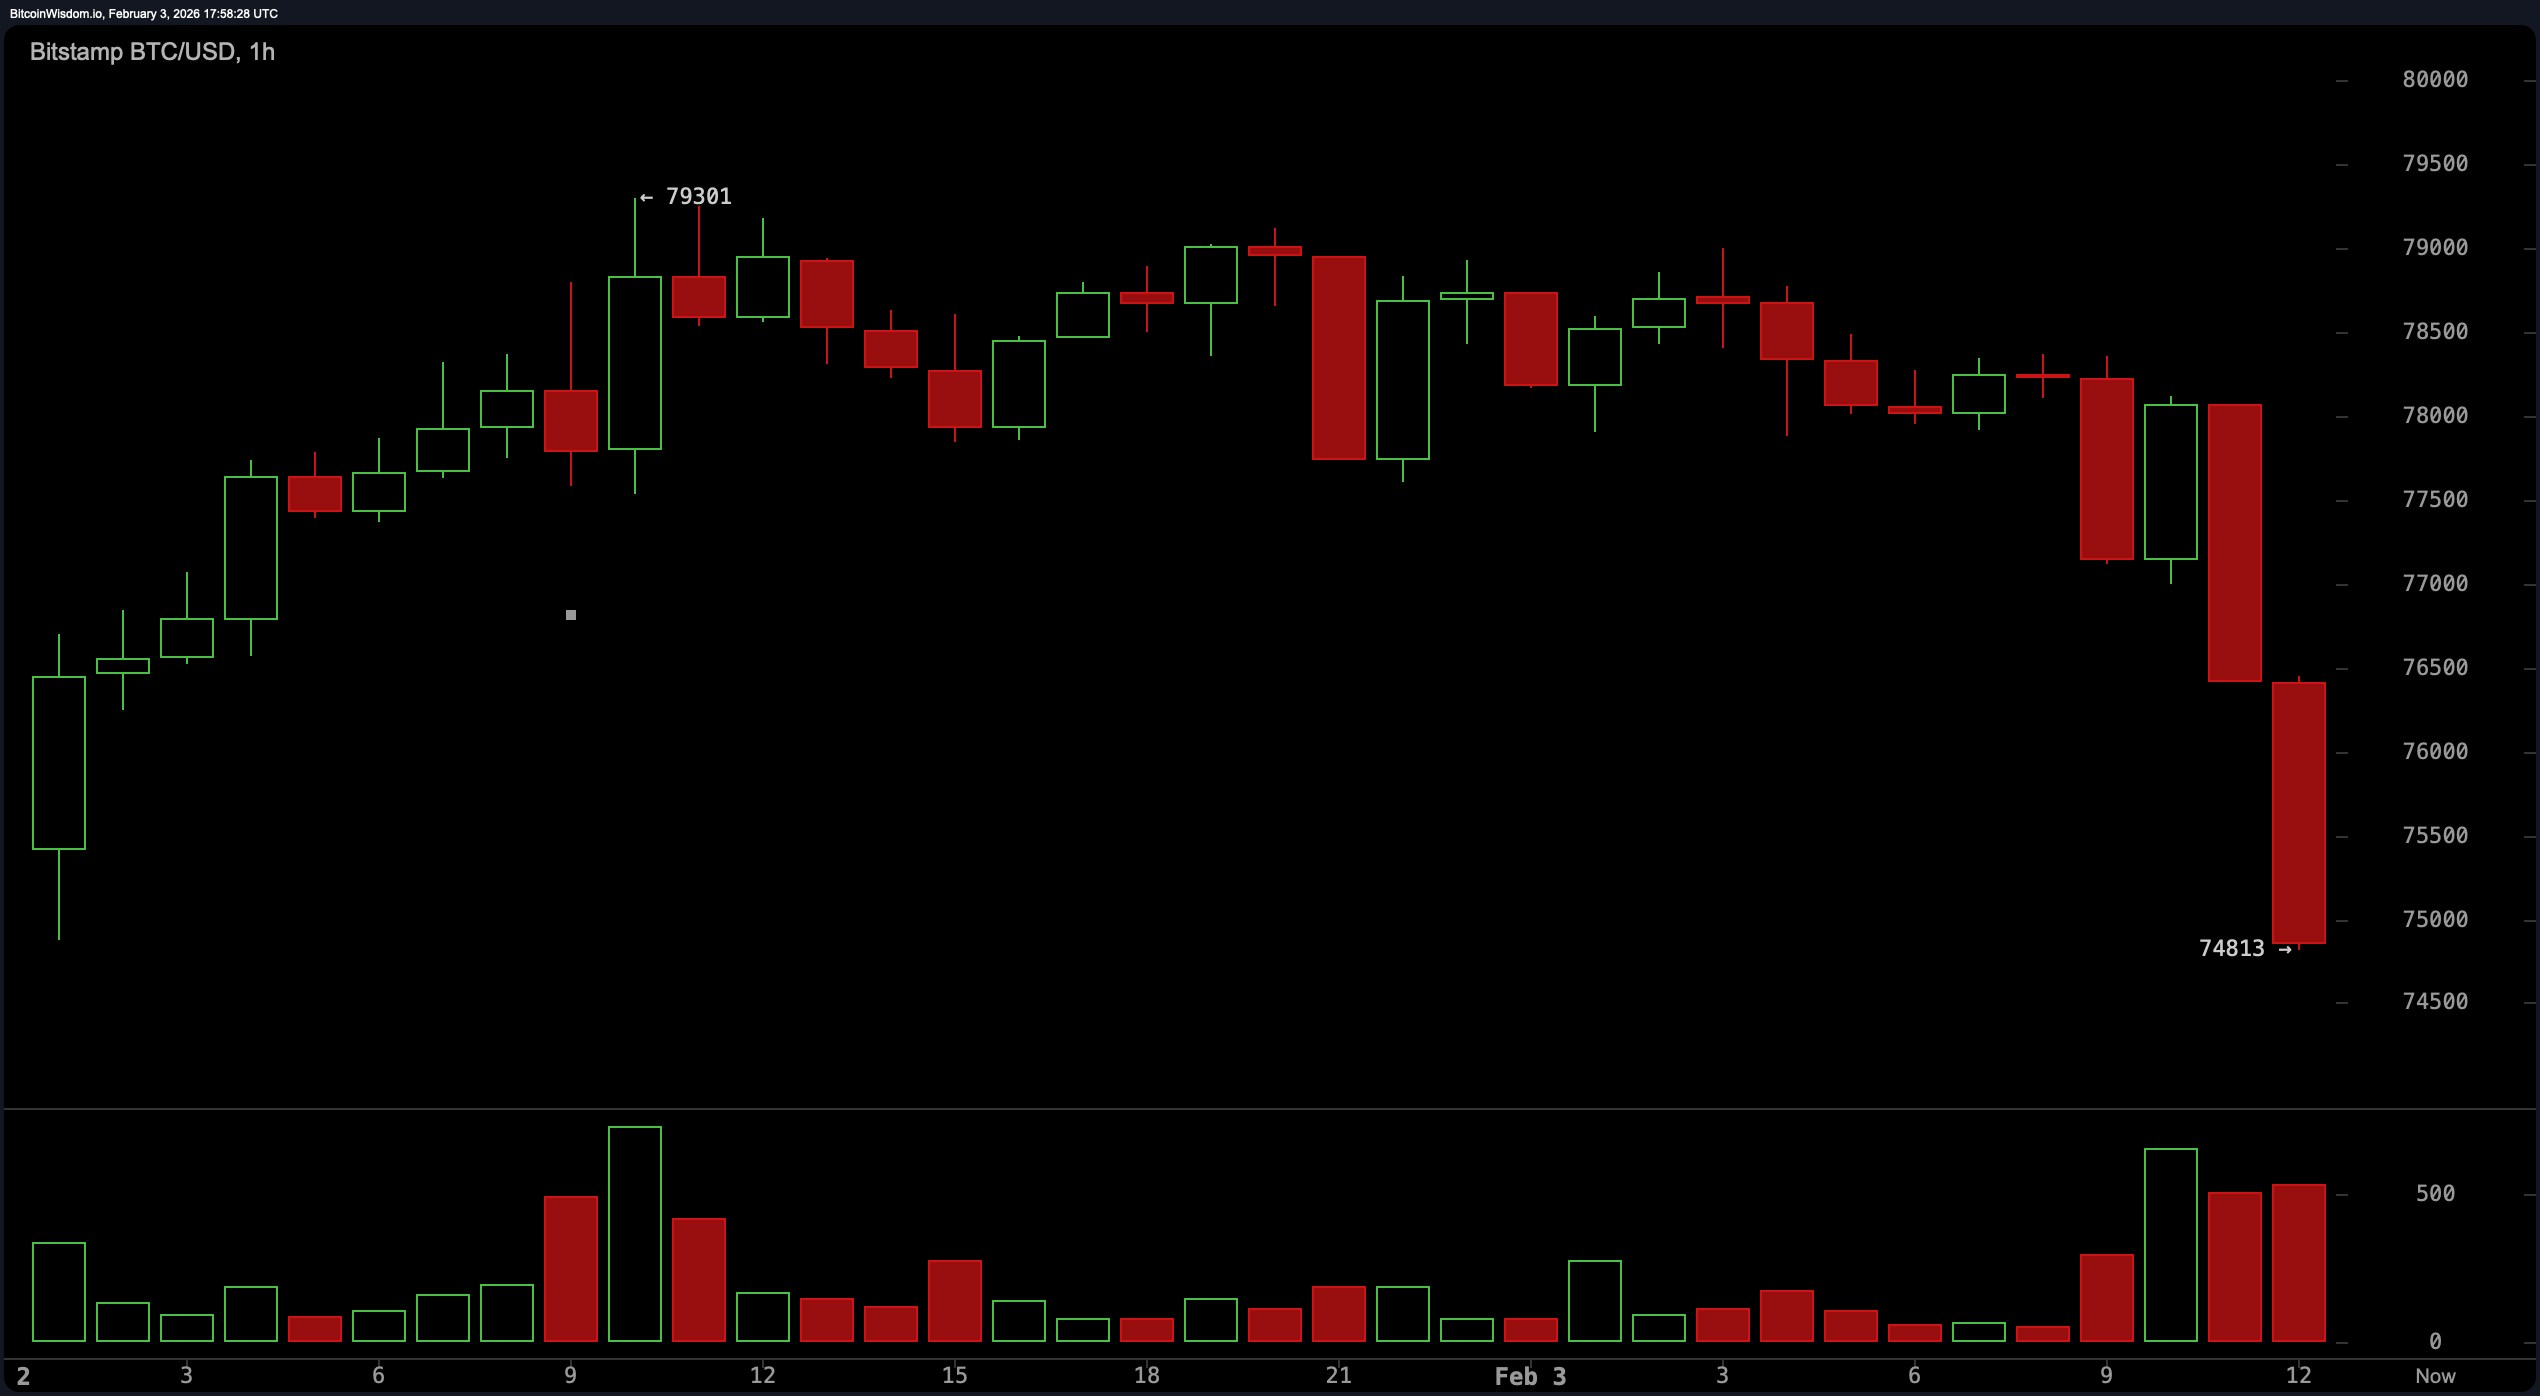
The BTC/USD 1-hour chart from Bitstamp on February 3rd shows bitcoin trading just below $75,000 at 1 p.m. EST.
After failing to hold above $77,500, support levels beneath offered minimal resistance until reaching mid-$75,000 territory. This shift transformed previous support into new overhead resistance rather than acting as a safety cushion. Noticeable volume spikes accompanied downward candles—indicating selling pressure instead of price rebounds—highlighting an imbalance favoring bears.
According to Coinglass liquidation data over the past 24 hours, $347.13 million in positions were liquidated, with long positions accounting for approximately $238.27 million. Ethereum (ETH) and Bitcoin (BTC) led these liquidations: bitcoin longs lost about $82 million, while ethereum longs suffered around $78.82 million.
The lack of significant buying interest near the critical $75,000 mark intensified concerns among traders who appeared more inclined to exit their holdings than defend key price levels. The decline concluded quietly around $75,100—not amid panic but with cold acceptance of the new reality.
Frequently Asked Questions 📉🐻⬇️
Why did bitcoin drop today?
Short-term charts displayed repeated failures close to $79,000 followed by strong selling pressure accompanied by rising volume.
What price level did bitcoin fall to?
Bitcoin slid from roughly between $78,000–$79,000 down toward approximately $75,100.
Which charts confirm this movement?
The one-hour chart along with five-minute and three-minute intervals all reveal descending highs coupled with breakdowns and robust bearish momentum.
Is this move supported by trading volume?
Yes—the increase in volume during selloffs across shorter time frames validates sustained selling activity driving prices lower.