The price of Bitcoin is currently stabilizing around a crucial support zone, forming a tightening triangular pattern that indicates market balance as traders anticipate a clear breakout or continuation.
Overview
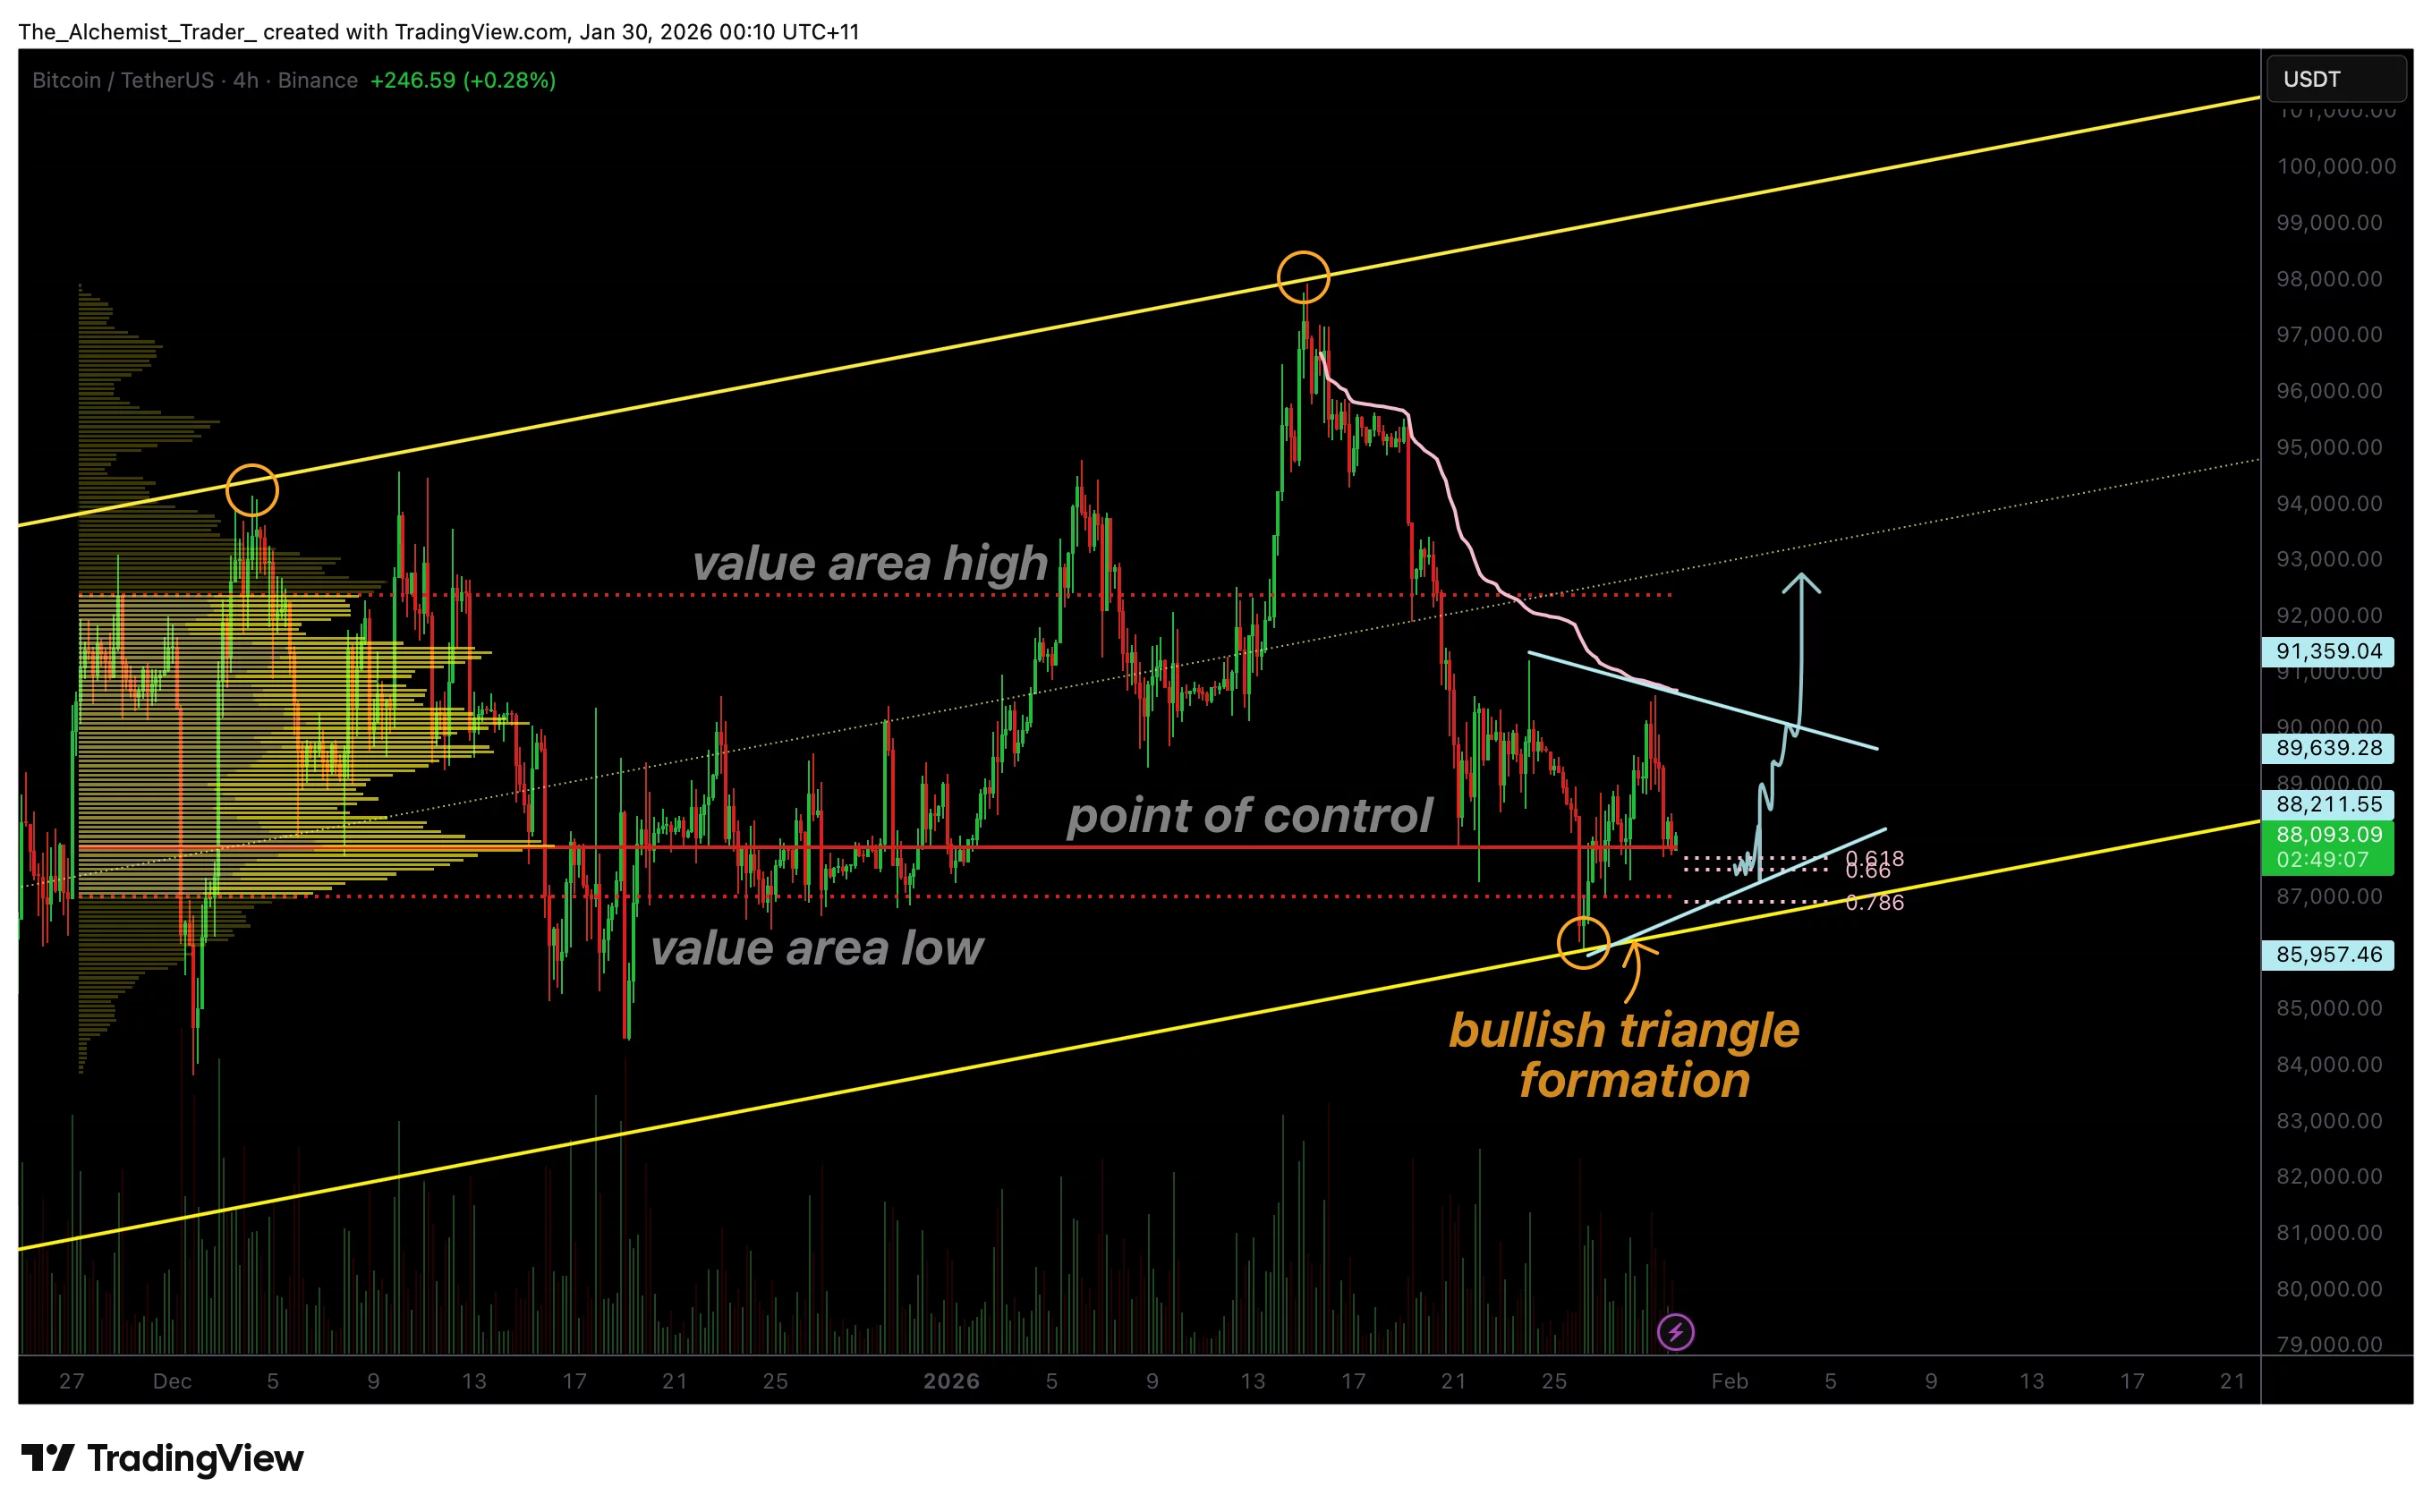
Bitcoin is developing a triangle formation near significant support levels.
Decreasing trading volume points to consolidation rather than an immediate breakout.
A confirmed breakout could push prices toward higher targets and resistance within the channel.
Following a corrective decline from recent peaks, Bitcoin’s price action has entered an important technical phase. After hitting local lows at channel support, BTC rallied from Monday’s open, signaling buying interest at lower price points.
However, this upward momentum has since diminished as the price moved back into an area of strong technical overlap. This pause has led to the emergence of a triangle pattern—often associated with equilibrium conditions and potential upcoming volatility expansion.
Key Technical Insights on Bitcoin Price
- A triangle structure is forming at key support levels, indicating compression and market indecision.
- The point of control (POC) acts as a pivot zone aligned with value area lows and Fibonacci retracement levels.
- A decline in volume suggests ongoing consolidation instead of impulsive moves forward.
The recent rebound off channel support marked an essential short-term response where buyers defended lower prices effectively. This upward move faced resistance but resulted in only controlled pullbacks rather than sharp rejections—indicating sellers aren’t aggressively overpowering demand yet.
Instead of breaking down further, the price shifted towards the POC—the level with highest traded volume during this range—which coincides closely with both value area low and 0.618 Fibonacci retracement zones. This convergence creates a dense technical region encouraging balanced two-way trading activity.
The Triangle Pattern Symbolizes Market Balance
This compression around overlapping supports forms what appears to be a classic triangle shape characterized by descending highs and ascending lows—a hallmark signifying neither buyers nor sellers hold dominant control currently.
This equilibrium setup reflects hesitation among participants who await confirmation before committing decisively in either direction. Triangles themselves do not inherently predict bullishness or bearishness but often precede significant volatility expansions once one side gains momentum after prolonged consolidation phases.
Diminishing Volume Reinforces Consolidation Scenario
The declining volume trend throughout this triangular development further supports that aggressive trading participation remains subdued for now—a typical feature during periods when markets coil tightly instead of trending strongly up or down immediately afterward.
Criteria for Confirming Bullish Breakout
An upside resolution from this triangular base will require robust buying volumes accompanying any break above its upper boundary; without such volume confirmation breakouts tend to fail and revert back inside prior ranges quickly.
Sustained trading above this boundary would signal renewed buyer dominance.
If successful breakthroughs occur, initial upside targets include reaching previous high-volume areas followed by testing resistance near broader channel limits where supply may reappear requiring validation for continued advances.
Potential Reversal Risks Remain Present
If current critical supports like POC combined with Fibonacci confluence fail to hold under selling pressure then bullish outlook weakens significantly.
A breakdown through the triangle would imply recent gains were corrective pauses within larger downward trends opening doors for renewed declines.
At present though no decisive breakdown signs have emerged while prices remain supported near these key zones.
Overall Bitcoin trades neutrally inside defined ranges reflecting indecision rather than directional certainty until confirmed breakouts happen leading likely volatile directional moves thereafter.
Outlook on Bitcoin Price Movement Ahead
The narrowing triangle signals approaching decision time where short-term sideways action may continue amid subdued volumes until clarity emerges via either sustained upside breaks accompanied by expanding volumes targeting higher resistance areas—or downside failures shifting focus lower again.
Patience remains essential while awaiting definitive directional cues guiding subsequent trade strategies.