Bitcoin is presently valued at $92,970, boasting an impressive market capitalization of $1.85 trillion. Within the last 24 hours, its price fluctuated between $91,917 and $95,467 on a trading volume totaling $41.72 billion. If Bitcoin were playing poker right now, it might be bluffing—holding steady after a heated round and daring others to challenge its position.
Technical Analysis of Bitcoin
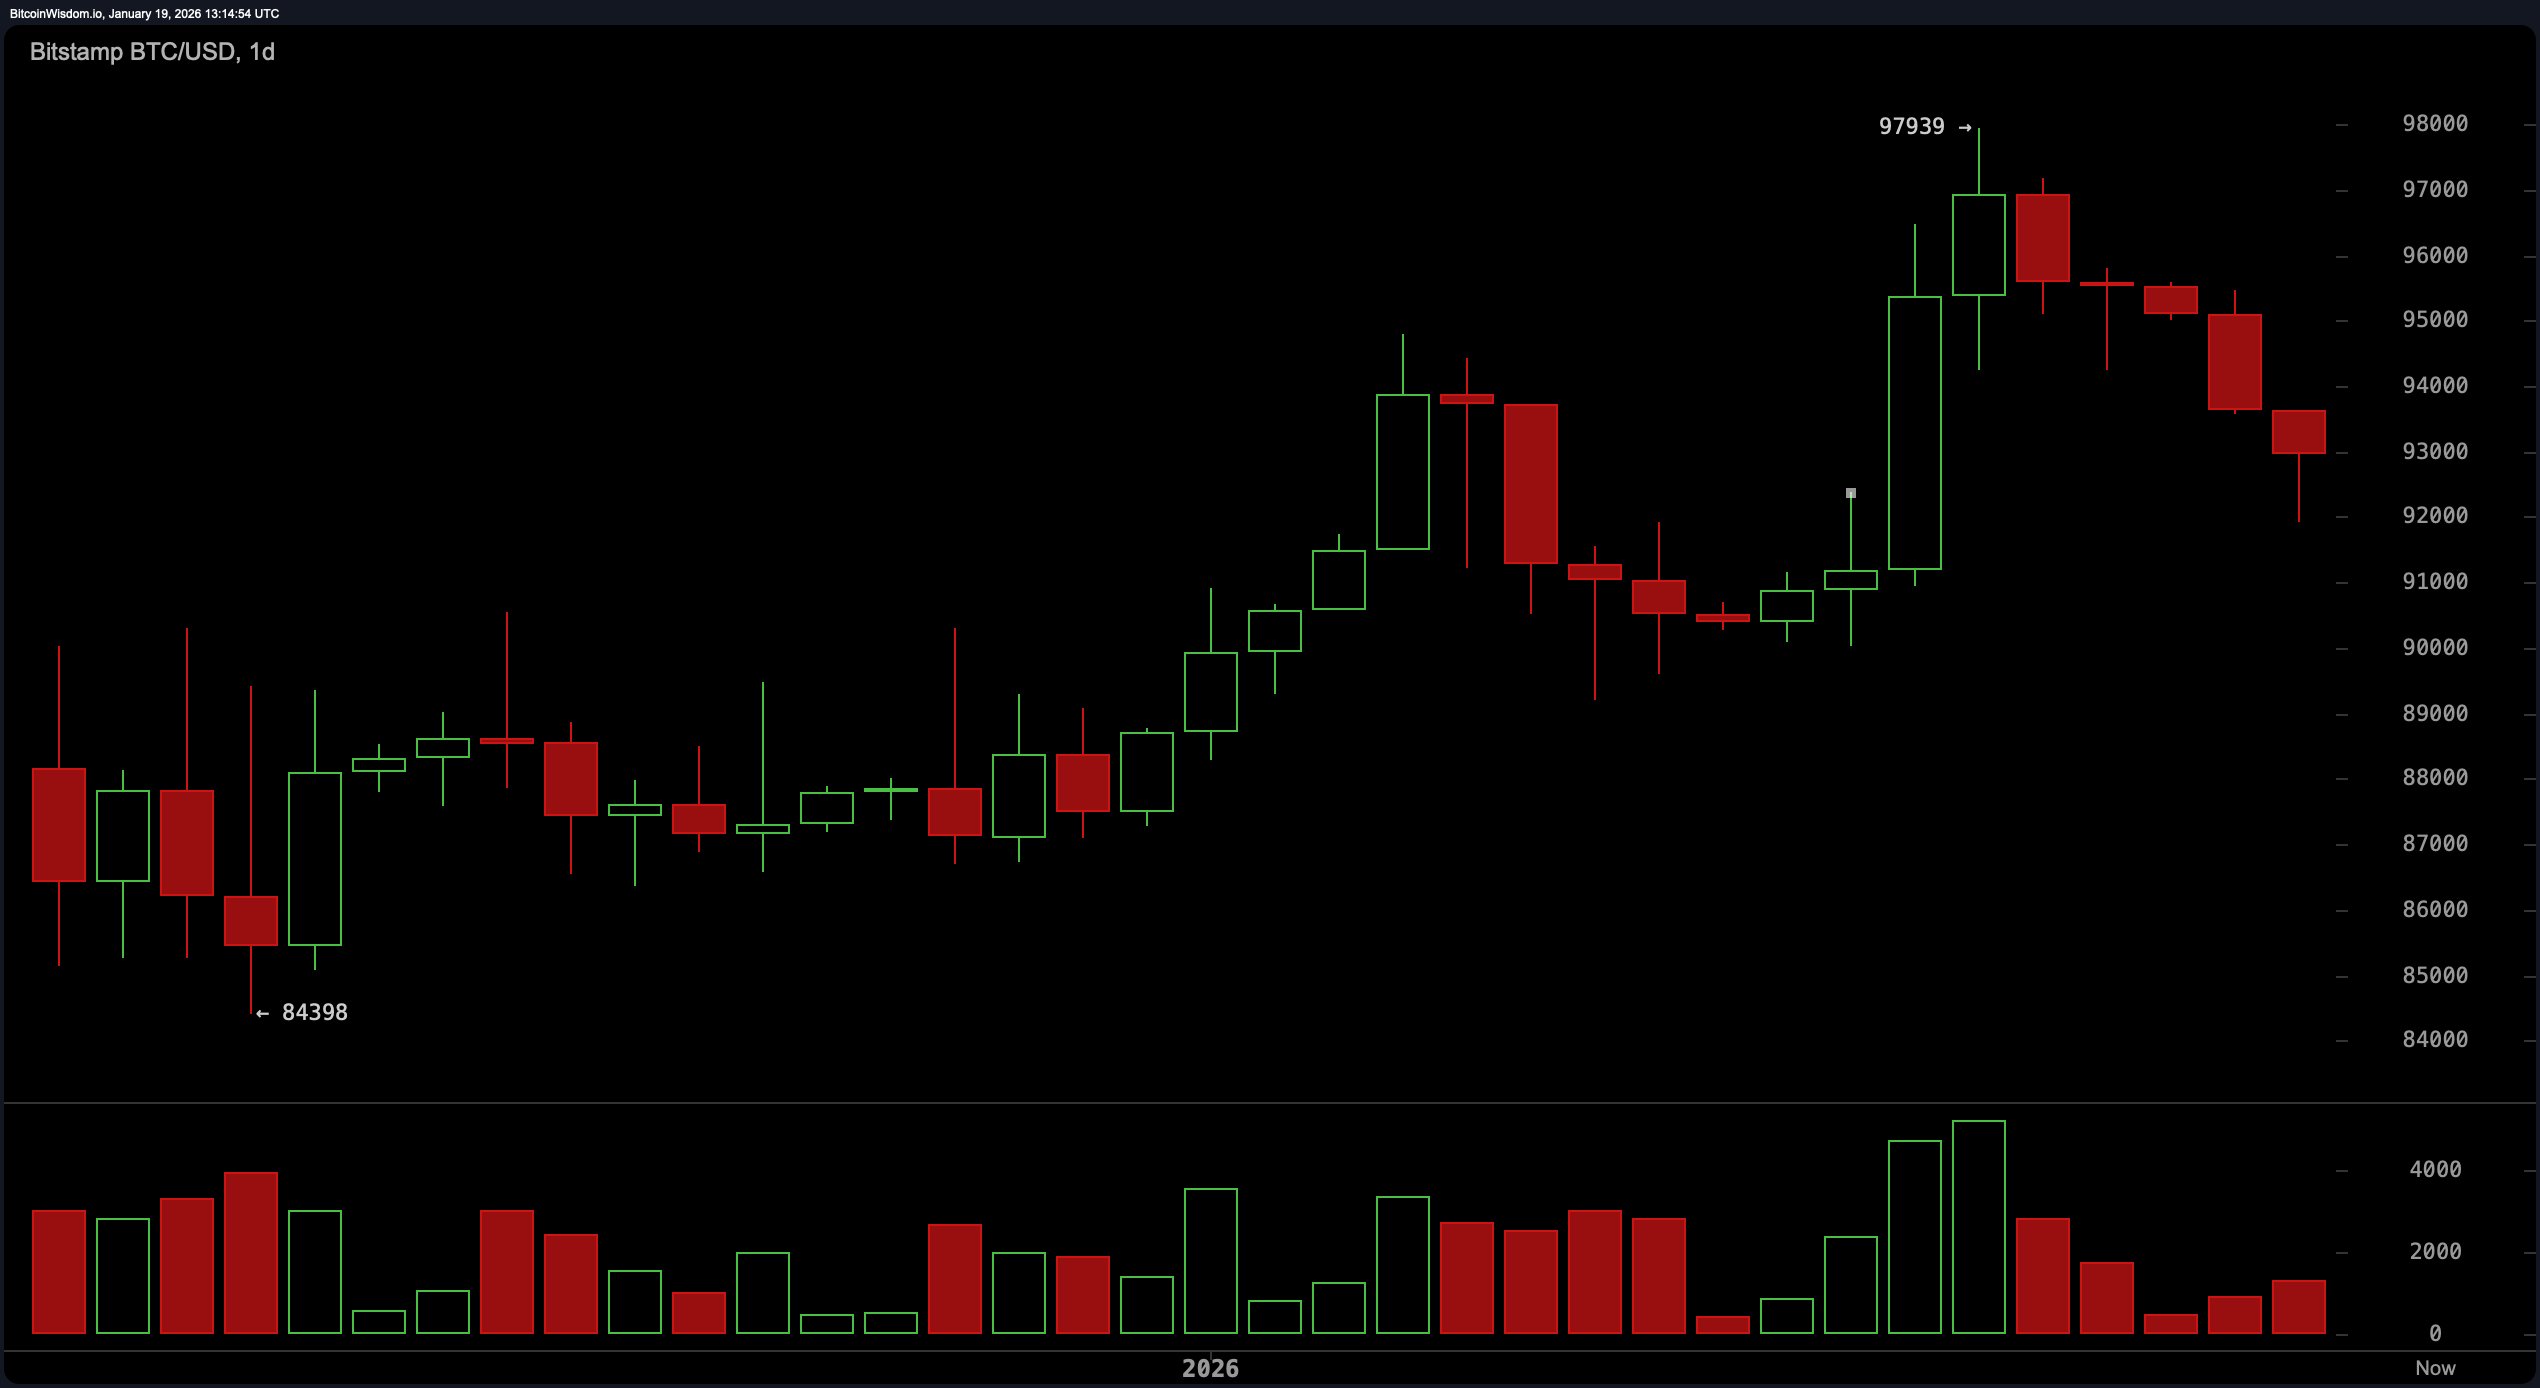
Following an exhilarating surge that peaked near $97,939, the daily chart signals caution with three consecutive red candles interrupting the bullish momentum. This suggests that traders are taking a breather as consolidation sets in after the recent rally.
The support level around $91,000 to $92,000 remains intact for now; however, the lack of upward momentum near previous highs indicates a classic retracement phase with resistance looming between $97,000 and $98,000.
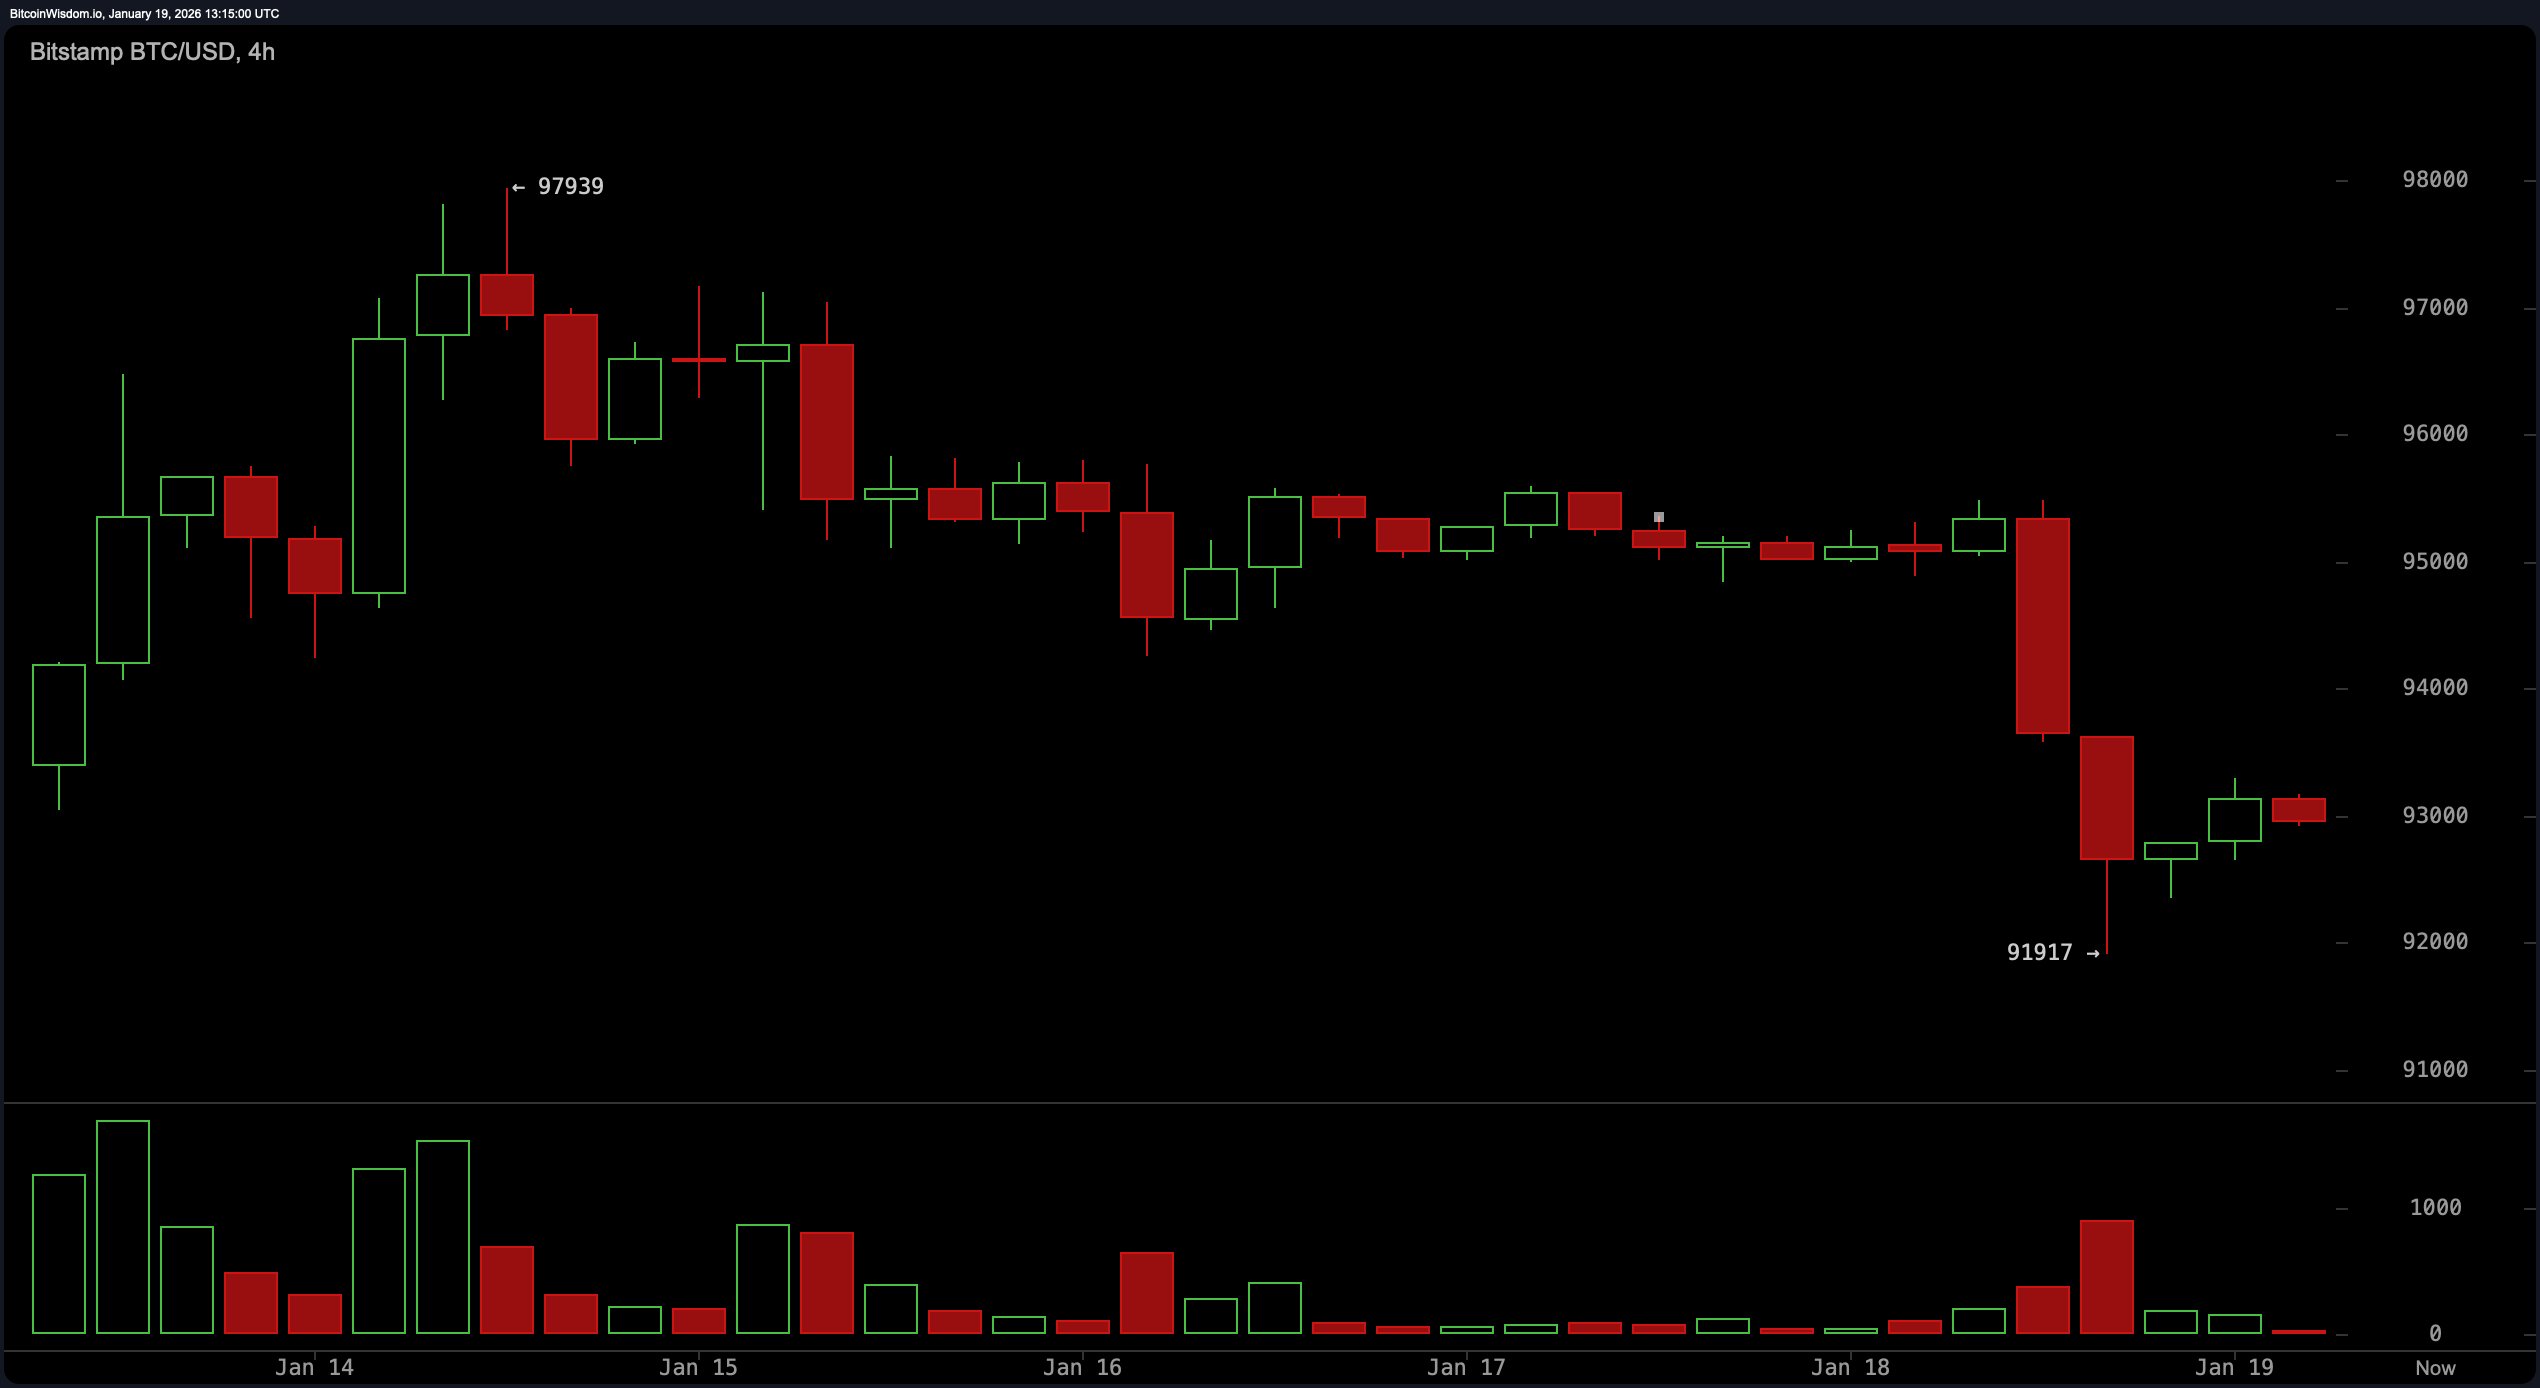
Diving into the 4-hour timeframe reveals more drama: a steep decline from approximately $95,480 down to about $91,917 accompanied by heightened volume indicates aggressive selling pressure rather than mere profit-taking. Subsequent attempts at recovery produced weak green candles resembling more of a temporary bounce than genuine bullish strength. The price hovering close to the mid-$93K mark reflects indecision as neither buyers nor sellers dominate.
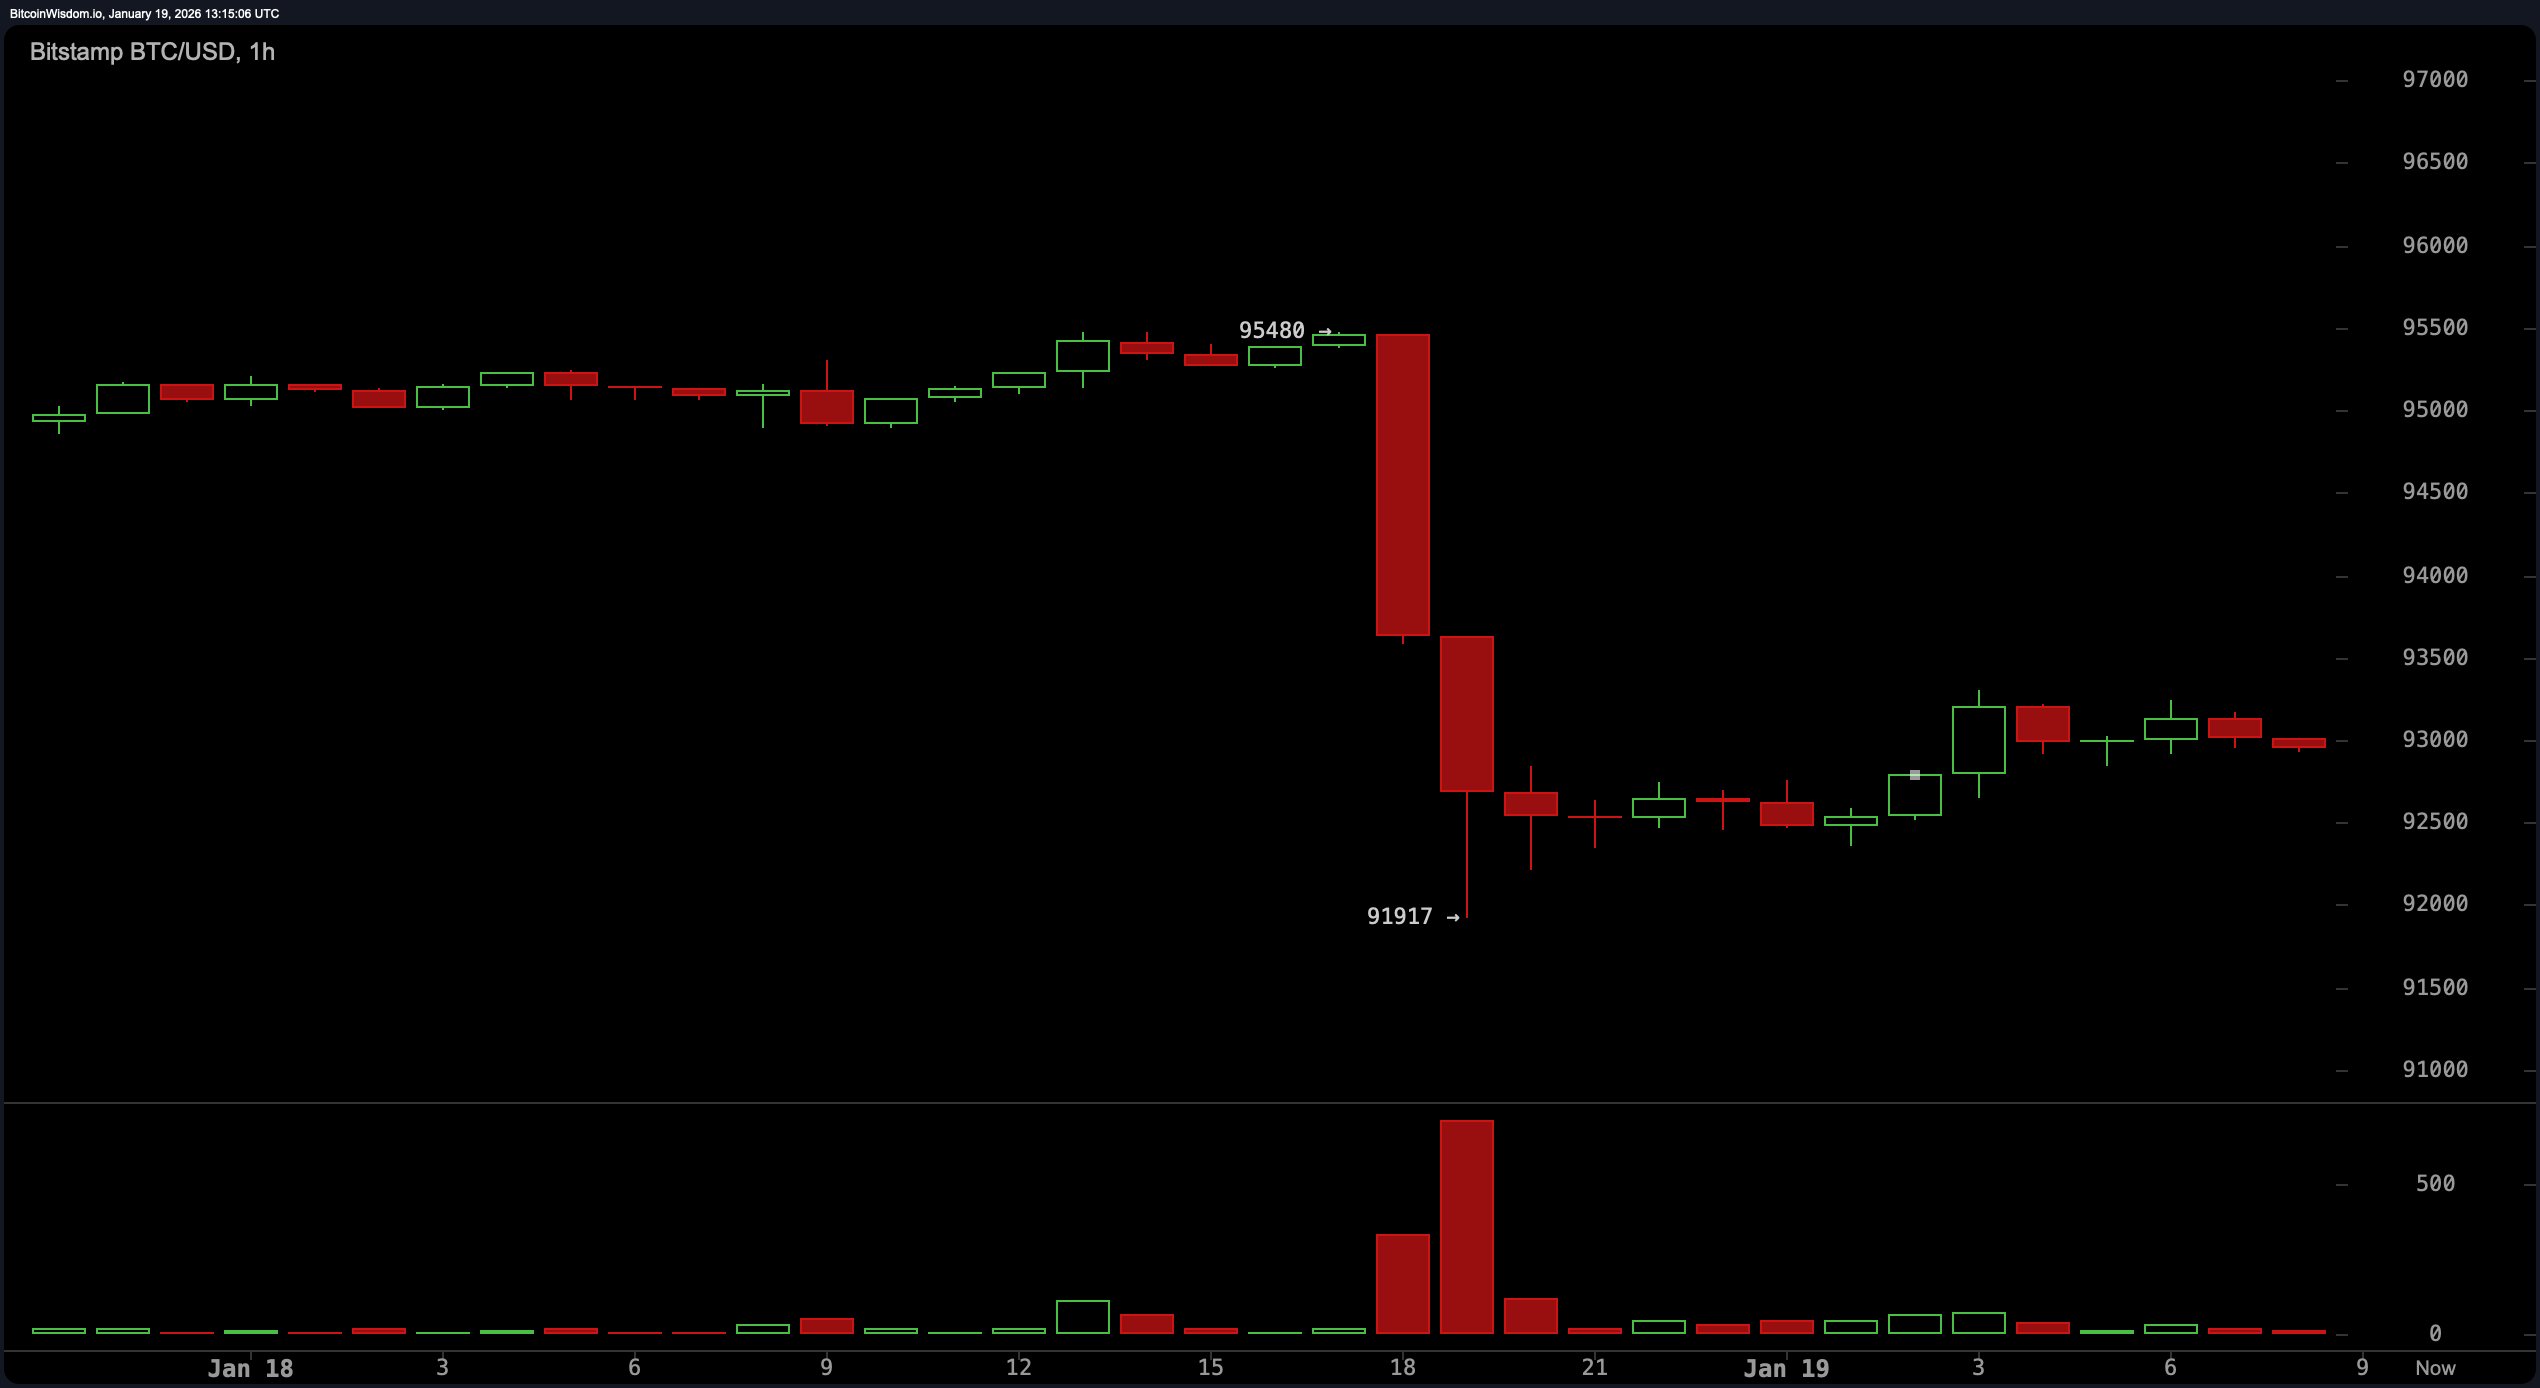
The hourly chart confirms this uncertainty through clear breakdowns highlighted by two strong red candles triggering liquidity sweeps. The modest rebound afterward feels like uneasy truce rather than victory for bulls or bears alike. Momentum has slowed considerably while volatility contracts into what appears to be early-stage sideways movement — traders await decisive action either above roughly $94K or below about$91K before committing further.
Momentum indicators mirror this mixed sentiment perfectly—the Relative Strength Index (RSI) stands neutral at 53 while Stochastic oscillators hover around 54 suggesting balanced forces in play.
The momentum oscillator leans bearish near 2470 points but MACD remains slightly positive at approximately 1287 signaling underlying bullish potential amidst complexity.
The Average Directional Index (ADX) reads moderate trend strength around level 33 indicating no clear directional dominance yet—a blend demanding cautious interpretation from market participants.
Moving averages present conflicting narratives too:
- Short-term EMAs &s SMAs (10-period) tilt bearish,
- Mid-term averages such as EMA/SMA(20) &a EMA(30) lean toward support,
- Longer-term moving averages including EMA(100) near$95&comma857 and SMA(200)$105&comma734 still cast bearish shadows over broader trends.
This divergence highlights uncertainty whether investors will hold their ground or retreat further.
The takeaway:
Despite pulling back from recent peaks,BTC isn’t out of contention just yet.The charts whisper cautionary notes instead of loud alarms.Traders should stay alert with tight risk management strategies in place.
Bullish Scenario:
If Bitcoin manages to maintain support within$91&comma000–$92&comma000 zone and decisively break above roughly$94&comma500,the bulls could reignite upward momentum targeting levels beyond$97&comma000.Mid-range moving averages combined with MACD favor continuation provided trading volumes increase accordingly.Be prepared though—this journey may remain volatile rather than smooth sailing.
Bearish Scenario:
A failure to defend key support around$91&period00 could trigger deeper declines toward approximately$88&period00 or even lower near$85&period00.Bearish alignment among critical moving averages coupled with exhausted buying pressure seen on shorter timeframes suggests sellers are poised for advantage.The bears lurk patiently awaiting confirmation before making their move.
Frequently Asked Questions ⏱️
- •&nbs;pWhat is bitcoin’s current price today?
- •&nbs;pAs of January19,&nbs;p2026,BTC trades close to&nbs;p92,&nbs;p970 USD.
- •&nbs;pIs bitcoin bullish or bearish right now?
- •&nbs;pThe market shows mixed signals featuring short-term weakness alongside mid-term supports offering some optimism.
- •&nbs;pWhat is bitcoin’s price support level?
- •&nbs;pPrimary floor lies between&nbs;p91000&yndash92000 USD range currently holding firm temporarily.
- •&nbs;pWhere is bitcoin’s next resistance?
- •&nbs;paddingMajor hurdles expected around&lpar95,500&rparand&lpar97,500&rparUSD marks ahead according technical analysis insights available so far..