
Bitcoin appears to be following a market pattern reminiscent of previous cycles that led to significant price surges. A trader specializing in high-timeframe analysis has pinpointed a fractal that closely resembles Bitcoin’s trajectory before the bull market of 2021. He suggests that the current phase is unfolding according to a well-documented structural narrative observed over various market cycles spanning more than ten years.
Bitcoin’s Fractal: Anchored in High-Timeframe Dynamics
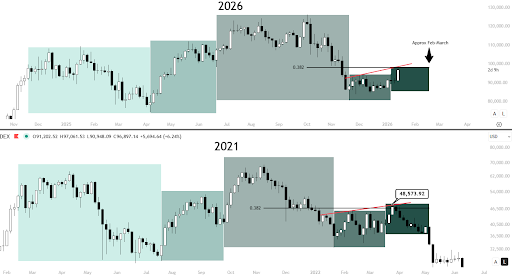
The fractal identified by this trader draws direct parallels between Bitcoin’s present cycle and its setup from 2021, as demonstrated in an accompanying chart. This visual representation aligns both timeframes, illustrating how prices progressed into an extensive distribution zone, subsequently entered a sharp corrective period, and then attempted recovery while facing downward resistance. In both instances, Bitcoin retraced to the 0.382 Fibonacci level before finding stability—indicating a common technical turning point rather than mere coincidental price overlap.
This structural alignment transcends mere price levels; it also encompasses timing aspects. The trader asserts that the current cycle has consistently mirrored past four-year cycles’ rhythms, enabling objective mapping of historical peaks and troughs. Within this framework, prior data suggested a high-probability short position near the peak candle around $123,000—strengthening his belief that recurring market structures continue to influence directional risk.
By directly comparing these two cycles, he contends that Bitcoin’s behavior is assessed through an enduring structural pattern maintained for over twelve years instead of being influenced by subjective biases.
$100,000 As A Structural And Psychological Barrier
The identified fractal highlights psychological resistance as crucial for determining Bitcoin’s upward potential. Reflecting on events from 2021 reveals how Bitcoin struggled to reclaim the $50,000 mark decisively; instead it approached but reversed at this threshold—setting behavioral expectations regarding traders’ reactions to significant round-number levels. In light of this established pattern within today’s context, $100,000 emerges as a comparable psychological barrier. Consequently, some investors might act preemptively leading up to this level which could create selling pressure from those holding underwater positions and distribution efforts by larger stakeholders.
This anticipated resistance is further supported by diagonal trendlines echoing those seen in 2021 which impose structural limits on upward momentum. Given these conditions short-term advances into the range of $98K–$99K remain plausible and align with the fractal since prices can approach this psychological ceiling comfortably enough; additionally positioning data gathered over six months indicates median short-term buyer cost bases clustering between $95K and $100K—pointing towards areas where profit-taking or defensive selling may escalate significantly.
These factors suggest scenarios where prices might challenge resistance levels only to experience temporary setbacks while adhering strictly within established structural confines without undermining broader high-timeframe theories about trends.
However it’s important for traders note: such frameworks are probabilistic—a sustained breakthrough above ranges like $104K–$105K would disrupt existing patterns necessitating comprehensive reevaluation concerning long-term trends overall.
Featured image created with Dall.E; chart sourced from Tradingview.com