Over the past week, U.S. spot Bitcoin exchange-traded funds experienced a significant decline, losing approximately $681 million as institutional interest seems to be waning. Nevertheless, technical charts still reveal a strongly bullish formation in play.
Bitcoin’s price has bounced back following a challenging week marked by outflows from ETFs totaling $681 million. An intriguing Adam and Eve pattern has been identified on the daily price chart.
Data from SoSoValue indicates that between January 5 and January 9, twelve spot Bitcoin ETFs collectively saw net withdrawals amounting to $681 million.
The largest hit was taken by Fidelity’s FBTC fund with an outflow of $481 million. Grayscale’s GBTC followed with losses of $171.8 million, while ARK Invest’s ARKB recorded outflows of about $45.4 million. Additionally, Grayscale’s smaller Bitcoin Trust alongside HODL and BITB ETFs combined for another withdrawal of roughly $46.1 million.
On the positive side, BlackRock’s IBIT attracted inflows worth around $25.9 million during this period, complemented by other ETFs contributing an additional net inflow close to $37.7 million.
This recent wave of redemptions came after a prior strong performance where investment vehicles had drawn in nearly $458.7 million—an influx that helped push Bitcoin above the critical threshold of $94,000 for the first time since early December last year.
However, this momentum proved short-lived as widespread profit-taking coupled with heightened volatility—triggered by massive liquidations within the Bitcoin market—exerted renewed downward pressure on BTC prices.
It appears that these conditions have cooled institutional appetite temporarily as investors await more stable market dynamics before re-entering aggressively.
Analyzing Bitcoin Price Movements
The price of Bitcoin (BTC) has clawed back some losses over recent days and was trading at approximately $91,652 as of midday on January 12 (Asian time). Despite this recovery effort,
the cryptocurrency remains about 27% below its all-time peak near $126,080 achieved on October 6th last year.
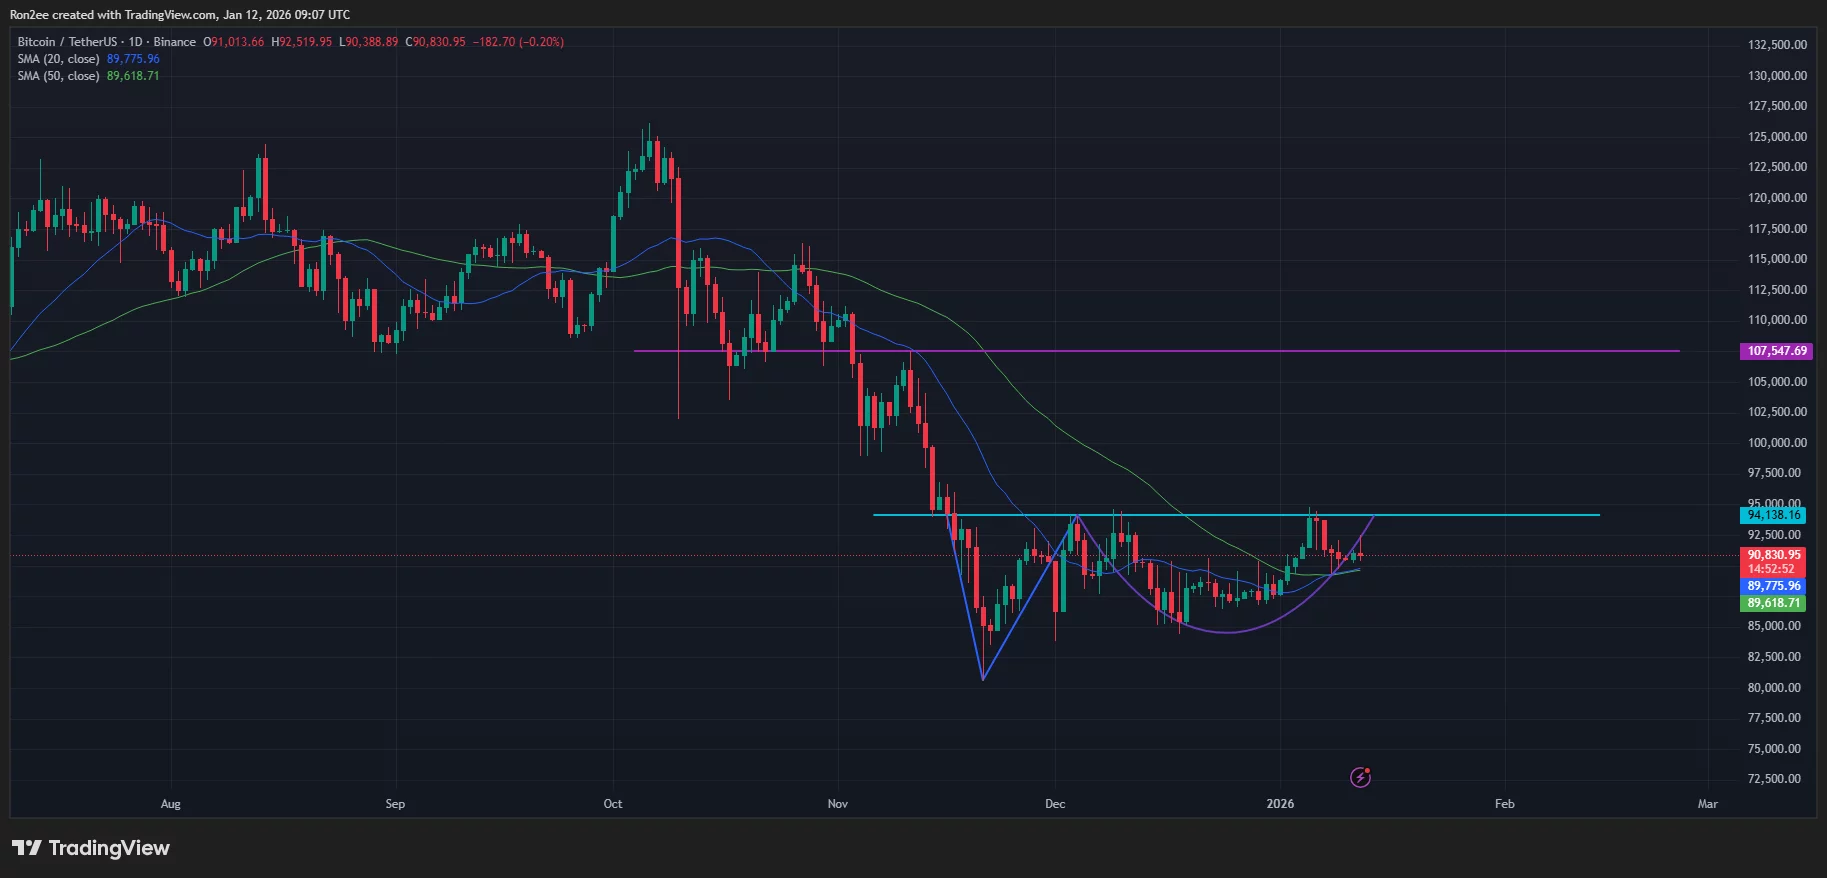
A closer look at daily charts reveals an Adam and Eve candlestick pattern emerging since mid-November.
This formation is characterized by a sharp V-shaped spike (“Adam”) followed by a rounded bottom (“Eve”), often signaling potential bullish reversals once prices break above neckline resistance levels.
If BTC successfully breaks through resistance near the neckline at around $94, 138,
buyers may set their sights next toward retesting November highs close to $107, 500 without facing many significant obstacles along the way.
Bullish sentiment is further supported technically: The shorter-term 20-day Simple Moving Average (SMA) recently crossed above its longer-term counterpart—the 50-day SMA—a classic indicator suggesting renewed upward momentum over shorter intervals.
Additionally,
momentum oscillators such as MACD lines were signaling buy opportunities when analyzed recently,
implying diminishing selling pressure among traders currently active in markets.

Conversely, $89, 600—which closely aligns with key support offered by the 50-day SMA—is expected to act as crucial defense territory for bulls seeking to prevent further declines in value.
→&; Read more : Coinbase might reconsider backing CLARITY Act if stablecoin rewards face bans
Please note: This article does not constitute financial advice or recommendations. The information presented here serves educational purposes only.