Bitcoin is currently stabilizing around the $90,000 threshold as global financial markets face ongoing challenges. Heightened geopolitical tensions in the Middle East, increasing doubts about the stability of fiat currencies in emerging economies, and macroeconomic fluctuations have once again drawn attention to BTC.
Analysis of Bitcoin Prices: Daily Overview
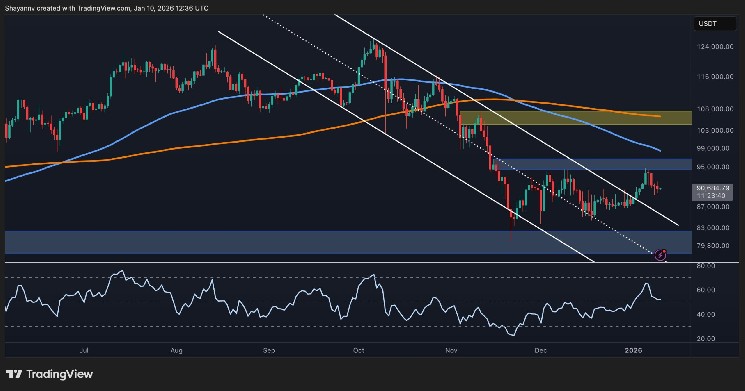
On the daily chart, BTC has emerged from its downward channel but encounters resistance close to the $95,000 mark. The surge from a low of $80,000 has been significant; however, it seems to be losing momentum after reaching this critical resistance level at $95k. The price has yet to reclaim its 100-day and 200-day moving averages located near $99k and $106k respectively.
The current market structure is shifting from bearish sentiment towards a neutral stance. If Bitcoin can maintain its position above the psychological barrier of $90k, there’s potential for forming a higher low which could pave the way for further movement towards both $95k and possibly even crossing into the crucial territory around $100k. Conversely, failing to hold above this level may result in a return to previous downtrend patterns.
BTC/USDT Four-Hour Chart
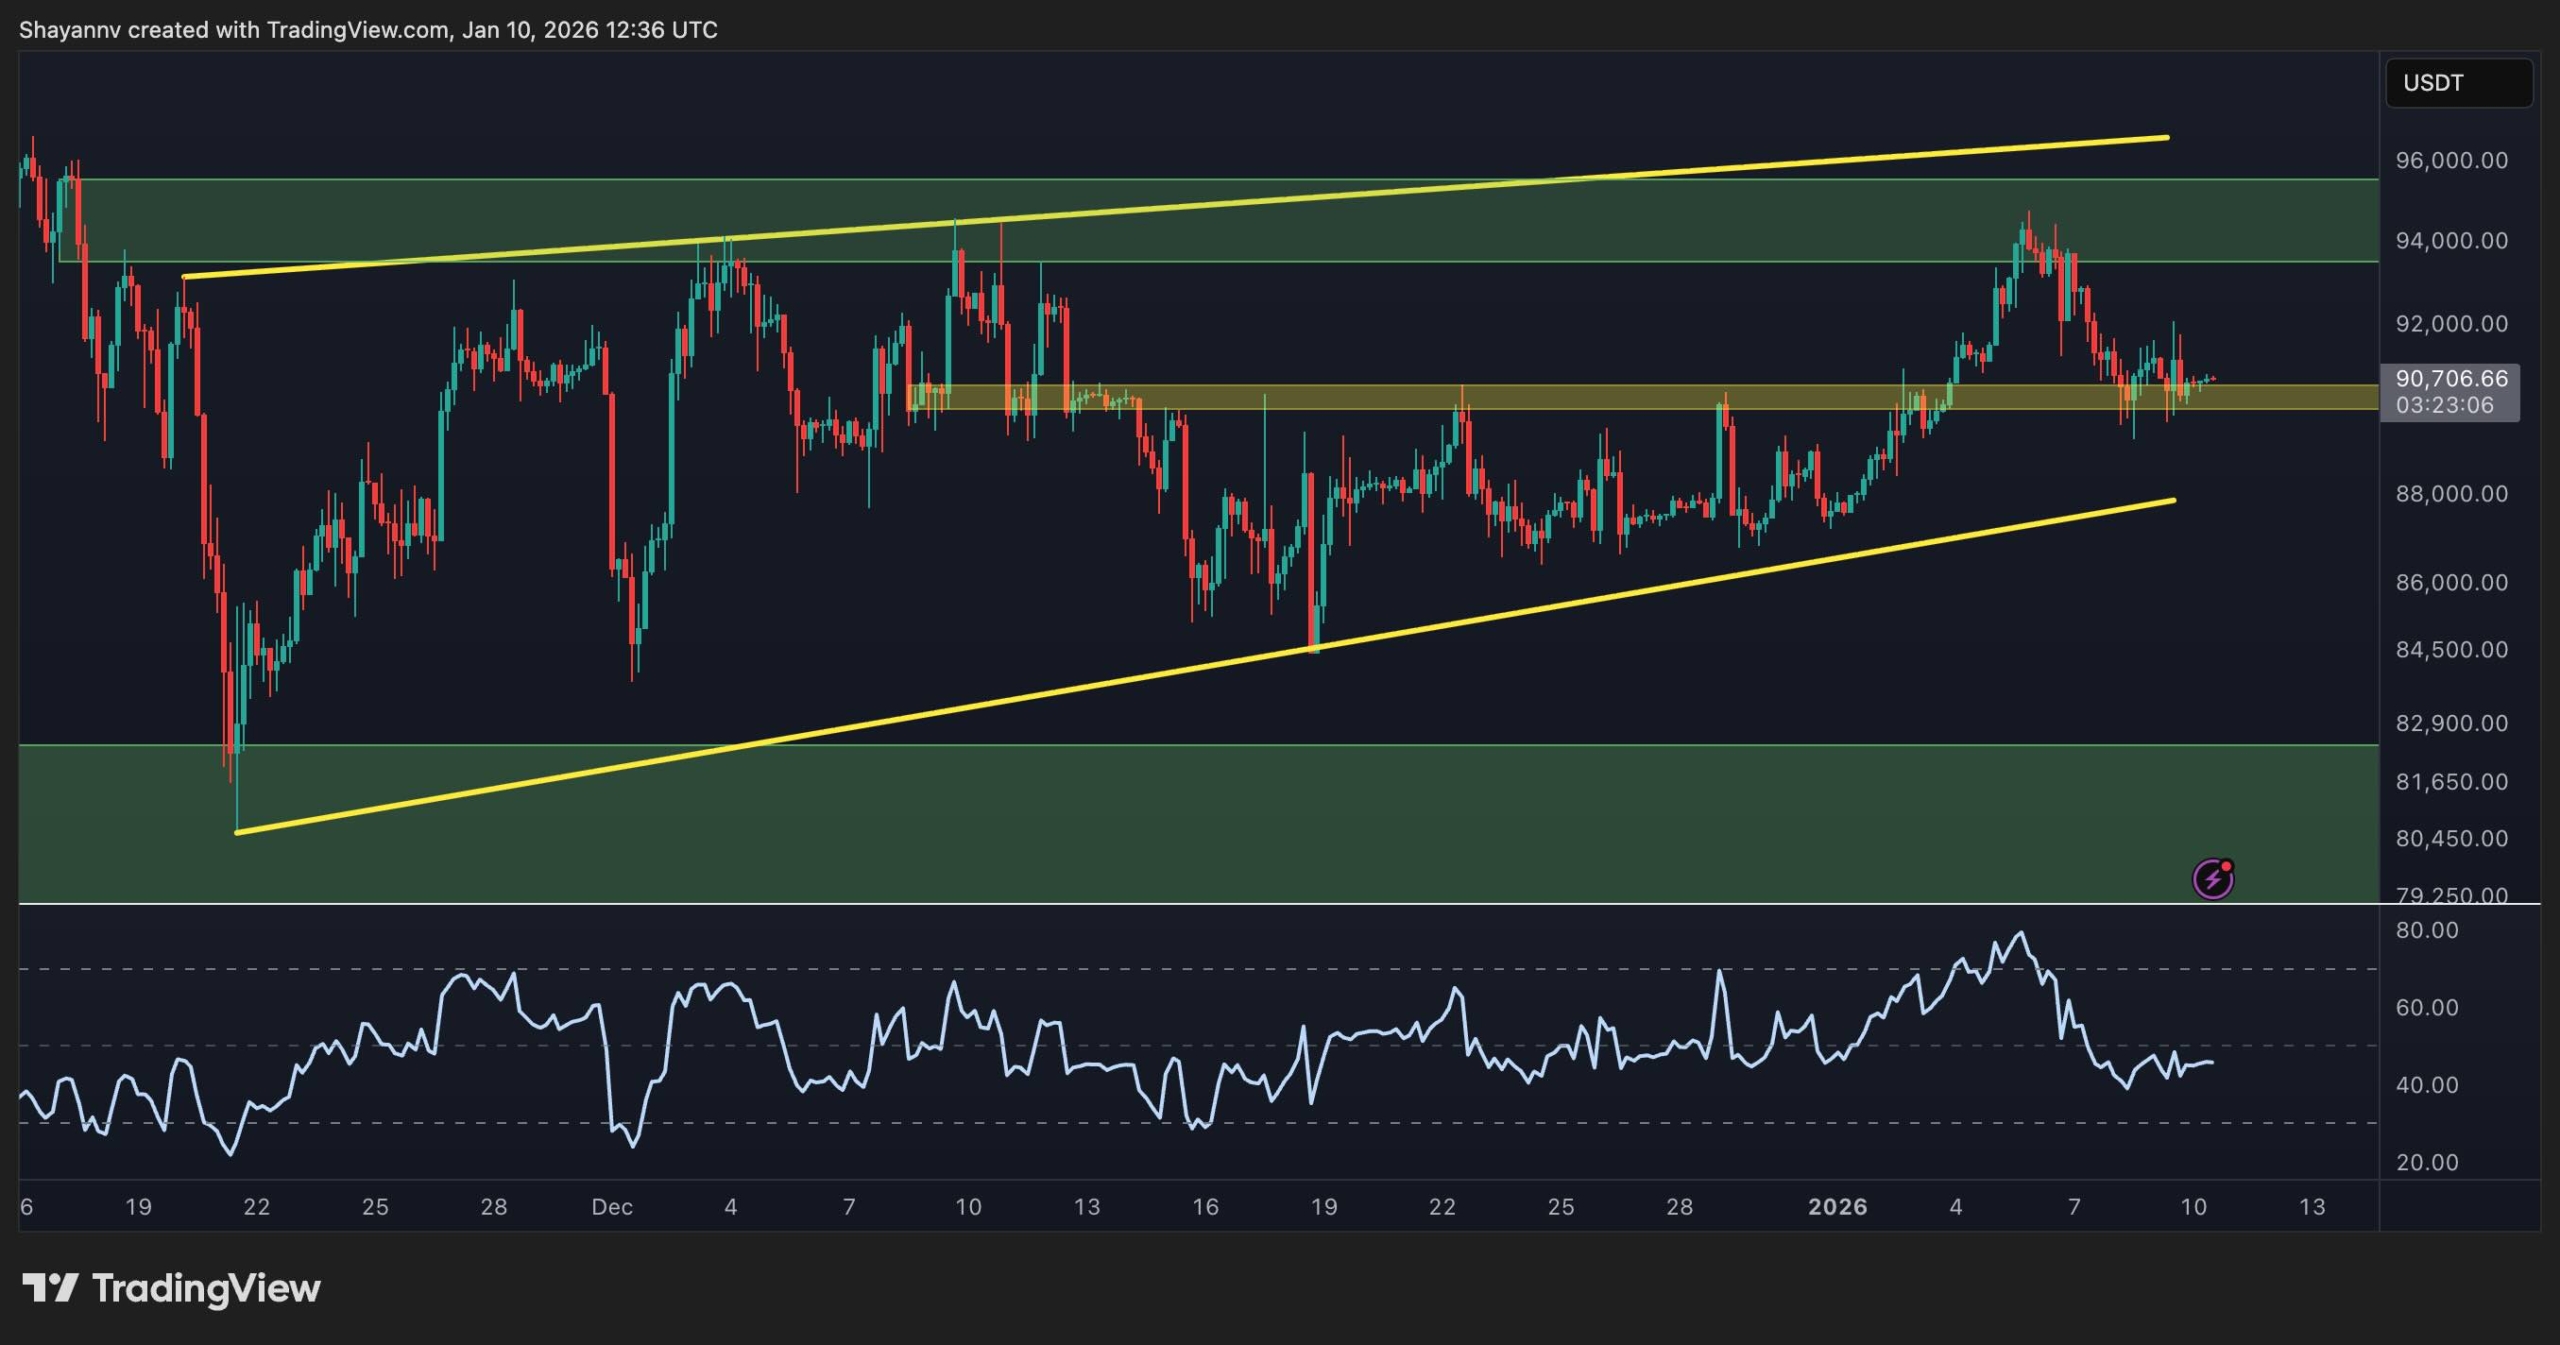
In terms of four-hour analysis, Bitcoin is currently consolidating within an ascending wedge formation with local support situated at approximately $90k and immediate resistance near $95k. This pattern indicates signs that bullish momentum may be weakening as RSI continues its descent despite prices remaining above significant support levels.
A drop below the pivotal level of $90K could hasten corrections toward lower bounds at around $88K within this pattern. On a positive note, breaking through resistance at approximately$95K might trigger renewed upward movement leading potentially towards an aggressive breakout typical for falling wedges. Until such developments occur though,BTC appears confined within narrowing trading ranges.
On-Chain Insights
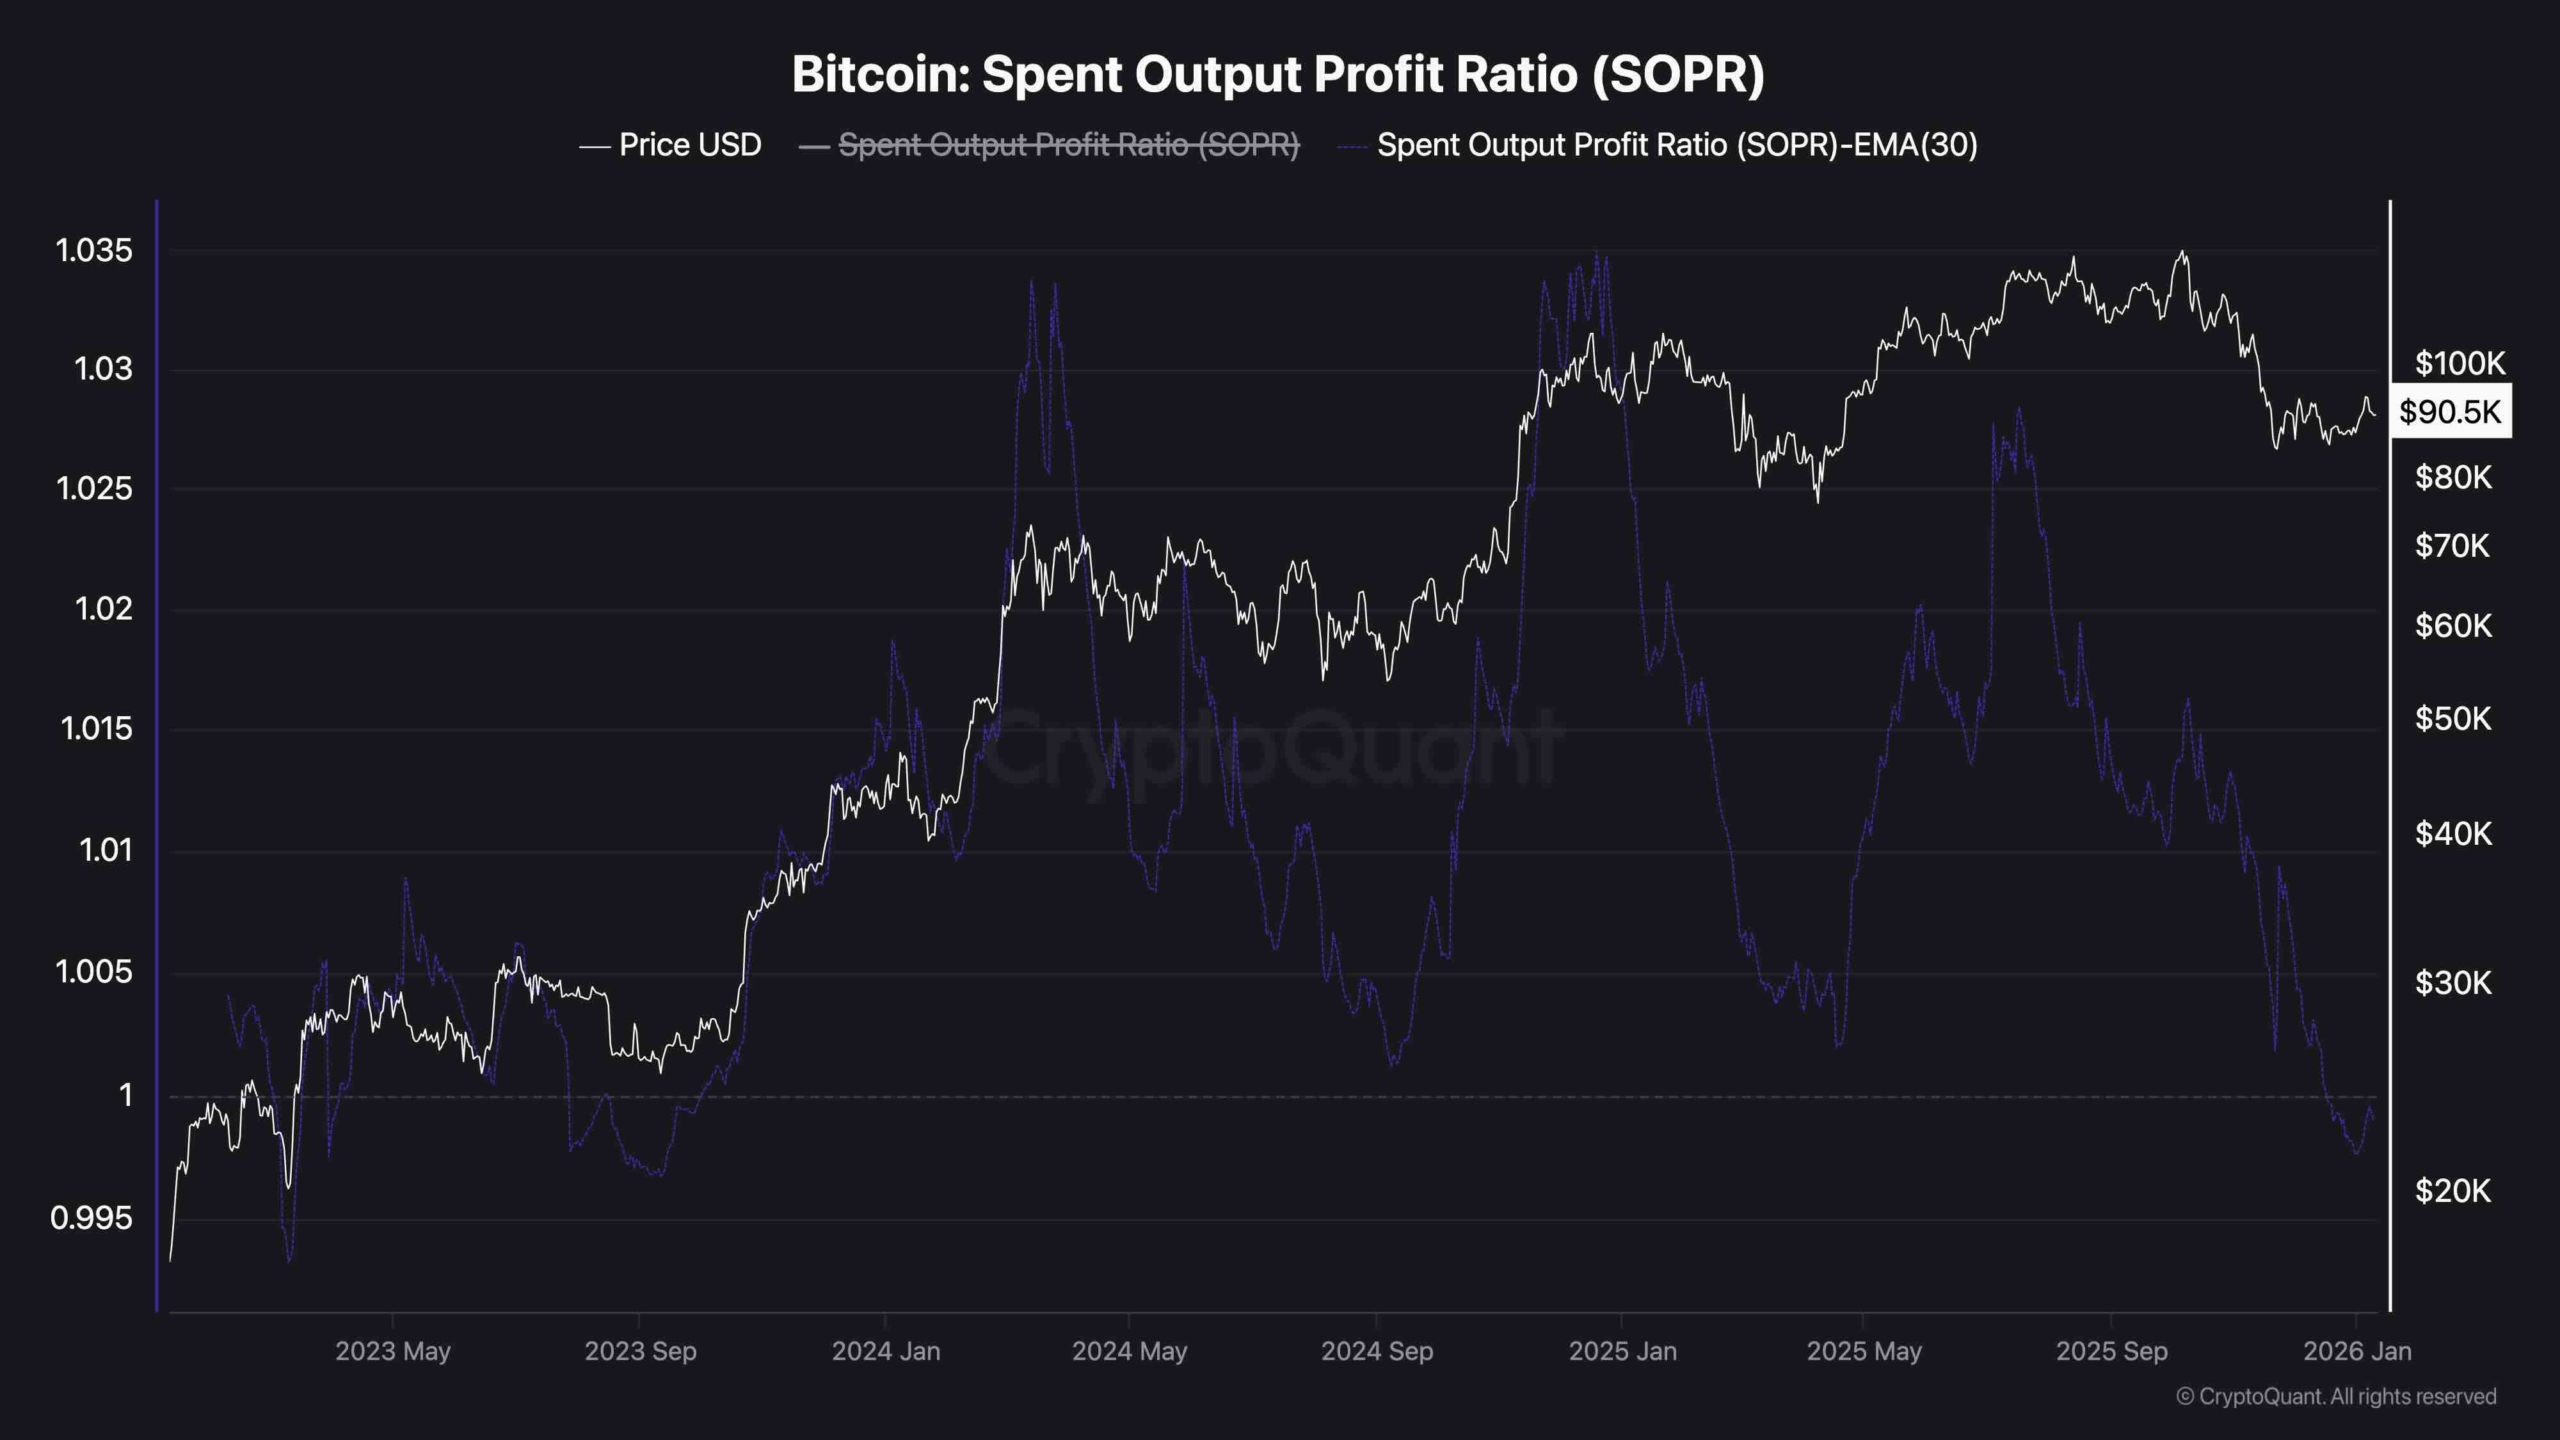
The 30-day EMA (Exponential Moving Average) for SOPR (Spent Output Profit Ratio) remains just beneath one point zero indicating that many coins being spent are incurring losses—implying numerous short-term holders are cashing out without profit gains achieved thus far.Historically speaking when SOPR dips below one before flattening out,it often signifies either nearing completion phases during corrections or accumulation efforts by more robust investors stepping in strategically .
This trend reveals some downside pressure on SOPR; nevertheless,the price action itself demonstrates relative strength.If BTC can remain stable over$90K while allowing time for SOPR adjustments ,it sets up favorable conditions potentially leading healthier rallies backed by solid foundations moving forward .